## Stacked Bar Chart: Reyes Heslop Consulting Profits (£ millions)
### Overview
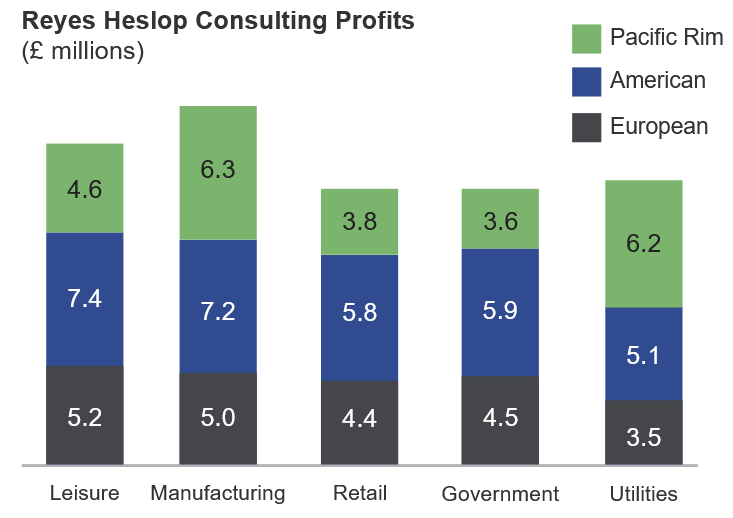
The chart displays segmented bar graphs representing consulting profits (in £ millions) across five sectors (Leisure, Manufacturing, Retail, Government, Utilities) for three regions: Pacific Rim (green), American (blue), and European (dark blue). Each bar is divided into three color-coded segments corresponding to regional contributions.
### Components/Axes
- **X-axis**: Sectors (Leisure, Manufacturing, Retail, Government, Utilities)
- **Y-axis**: Profit values in £ millions (no explicit scale, inferred from segment heights)
- **Legend**:
- Green = Pacific Rim
- Blue = American
- Dark Blue = European
- **Segmentation**: Bars are stacked vertically, with European (dark blue) at the base, American (blue) in the middle, and Pacific Rim (green) at the top.
### Detailed Analysis
#### Leisure
- European: 5.2 (dark blue)
- American: 7.4 (blue)
- Pacific Rim: 4.6 (green)
- **Total**: £17.2M
#### Manufacturing
- European: 5.0 (dark blue)
- American: 7.2 (blue)
- Pacific Rim: 6.3 (green)
- **Total**: £18.5M
#### Retail
- European: 4.4 (dark blue)
- American: 5.8 (blue)
- Pacific Rim: 3.8 (green)
- **Total**: £14.0M
#### Government
- European: 4.5 (dark blue)
- American: 5.9 (blue)
- Pacific Rim: 3.6 (green)
- **Total**: £14.0M
#### Utilities
- European: 3.5 (dark blue)
- American: 5.1 (blue)
- Pacific Rim: 6.2 (green)
- **Total**: £14.8M
### Key Observations
1. **American Region Dominance**: Consistently the highest contributor across all sectors, peaking in Leisure (£7.4M) and Manufacturing (£7.2M).
2. **Pacific Rim Peaks**: Highest profits in Manufacturing (£6.3M) and Utilities (£6.2M), suggesting stronger performance in industrial/utility sectors.
3. **European Weakness**: Lowest profits in Utilities (£3.5M) and Retail (£4.4M), indicating potential market challenges.
4. **Government Sector**: Uniformly the least profitable across all regions (£3.6M–£4.5M).
5. **Leisure Sector**: Highest total profits (£17.2M), driven by American contributions.
### Interpretation
The data reveals regional disparities in consulting demand and profitability. The American region’s dominance in Leisure and Manufacturing aligns with potential economic strength in these sectors. The Pacific Rim’s outperformance in Manufacturing and Utilities may reflect regional industrial growth or strategic focus. European underperformance in Utilities and Retail could signal market saturation or competitive pressures. The Government sector’s consistent low profits across regions might indicate regulatory constraints or lower private-sector engagement. Overall, the chart underscores the importance of sector-specific strategies for regional optimization.