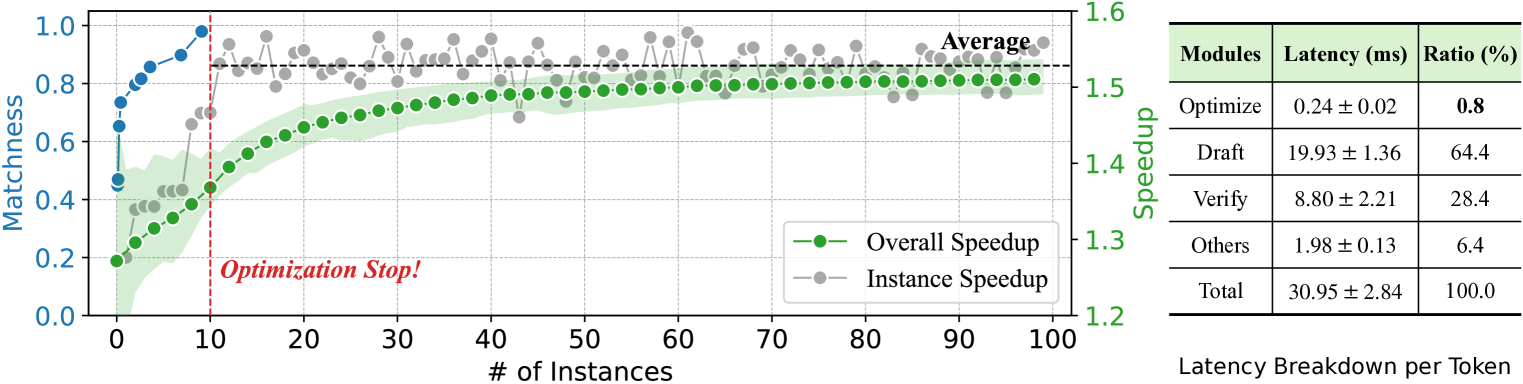
## Chart: Speedup vs. Number of Instances
### Overview
This chart illustrates the relationship between the number of instances and the resulting speedup and matchness, along with a latency breakdown per token. Two speedup curves are presented: an overall speedup and an instance speedup. The chart also shows the matchness as a function of the number of instances. A vertical dashed red line indicates an "Optimization Stop!" point.
### Components/Axes
* **X-axis:** "# of Instances" - Ranging from 0 to 100, with markers at intervals of 10.
* **Y-axis (left):** "Matchness" - Ranging from 0.0 to 1.0, with markers at intervals of 0.2.
* **Y-axis (right):** "Speedup" - Ranging from 1.2 to 1.6, with markers at intervals of 0.1.
* **Legend:** Located in the center-right of the chart.
* "Overall Speedup" - Represented by green circles connected by a solid line.
* "Instance Speedup" - Represented by gray circles connected by a dashed line.
* **Annotation:** "Optimization Stop!" - A vertical dashed red line at approximately instance 15.
* **Annotation:** "Average" - A label placed near the end of the Instance Speedup line.
* **Table:** "Latency Breakdown per Token" - Located in the bottom-right corner. Columns are "Modules", "Latency (ms)", and "Ratio (%)".
### Detailed Analysis or Content Details
**Matchness:**
The Matchness starts at approximately 0.0 at 0 instances and increases rapidly, approaching 0.85-0.90 by 20 instances. The rate of increase slows down as the number of instances increases, leveling off around 0.95-1.0 after 60 instances.
**Overall Speedup (Green Line):**
The Overall Speedup line starts at approximately 1.3 at 0 instances. It exhibits a steep upward slope initially, reaching around 1.52 at 10 instances. The slope gradually decreases, and the line plateaus around 1.55-1.57 after 50 instances, with a slight fluctuation towards the end.
**Instance Speedup (Gray Line):**
The Instance Speedup line begins at approximately 1.58 at 0 instances. It shows a slight downward trend initially, decreasing to around 1.52 at 10 instances. The line remains relatively stable between 1.50 and 1.55 for the remainder of the instances, with some minor fluctuations. The "Average" label is placed near the end of the line, indicating an average value of approximately 1.56.
**Latency Breakdown per Token (Table):**
| Modules | Latency (ms) | Ratio (%) |
|---|---|---|
| Optimize | 0.24 ± 0.02 | 0.8 |
| Draft | 19.93 ± 1.36 | 64.4 |
| Verify | 8.80 ± 2.21 | 28.4 |
| Others | 1.98 ± 0.13 | 6.4 |
| Total | 30.95 ± 2.84 | 100.0 |
### Key Observations
* The "Optimization Stop!" point at approximately 15 instances suggests that adding more instances beyond this point yields diminishing returns in terms of speedup.
* The Instance Speedup remains relatively constant after the initial decrease, while the Overall Speedup continues to increase, albeit at a decreasing rate.
* The Draft module contributes the largest portion (64.4%) to the total latency.
* The Matchness approaches 1.0 with a relatively small number of instances (around 60).
### Interpretation
The chart demonstrates the benefits of increasing the number of instances for processing, as evidenced by the initial increase in Overall Speedup and Matchness. However, it also highlights the point of diminishing returns, indicated by the "Optimization Stop!" annotation. The relatively stable Instance Speedup suggests that the performance gain from adding more instances is limited after a certain point. The latency breakdown reveals that the "Draft" module is the primary bottleneck in the process, suggesting that optimizing this module could lead to significant performance improvements. The high Matchness achieved with a moderate number of instances indicates that the system is able to maintain accuracy even as the number of instances increases. The difference between the Overall and Instance Speedup suggests that there are overheads associated with coordinating multiple instances.