## Dual-Axis Line Chart with Latency Breakdown Table
### Overview
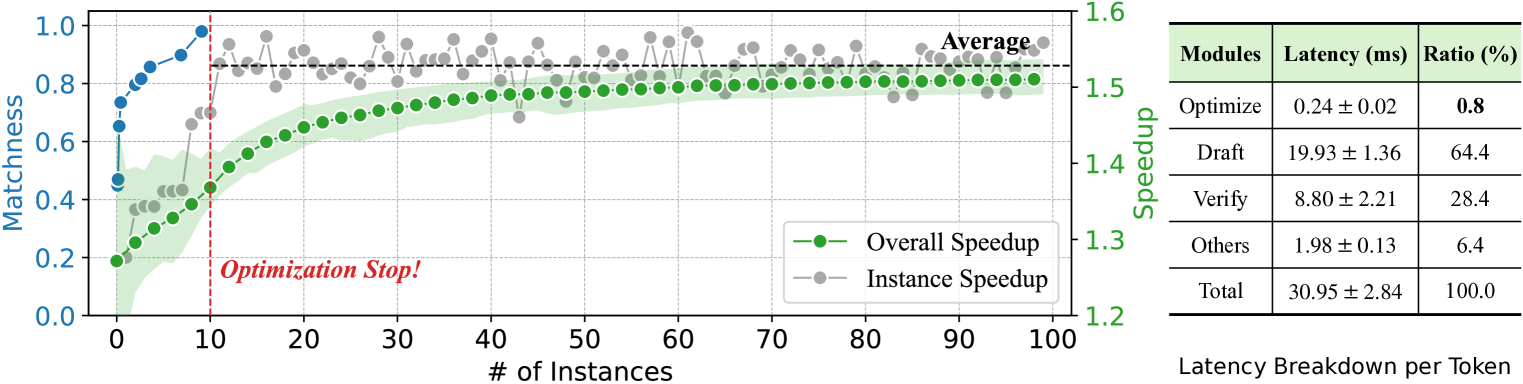
The image displays a dual-axis line chart on the left, plotting "Matchness" and "Speedup" against the number of instances, alongside a data table on the right titled "Latency Breakdown per Token." The chart visualizes the performance of an optimization process over 100 instances, showing improvements in matchness and speedup, with a notable event marked at 10 instances.
### Components/Axes
**Chart Area (Left Side):**
* **X-Axis:** Labeled "# of Instances". Scale runs from 0 to 100 with major ticks every 10 units.
* **Primary Y-Axis (Left):** Labeled "Matchness". Scale runs from 0.0 to 1.0 with major ticks every 0.2 units.
* **Secondary Y-Axis (Right):** Labeled "Speedup". Scale runs from 1.2 to 1.6 with major ticks every 0.1 units.
* **Legend:** Located in the bottom-right corner of the chart area.
* Green line with circular markers: "Overall Speedup"
* Gray line with circular markers: "Instance Speedup"
* **Data Series:**
1. **Blue Line (Matchness):** A solid blue line with circular markers, plotted against the left y-axis.
2. **Green Line (Overall Speedup):** A solid green line with circular markers, plotted against the right y-axis. It is accompanied by a light green shaded area, likely representing a confidence interval or variance.
3. **Gray Dots (Instance Speedup):** Individual gray circular markers scattered across the chart, plotted against the right y-axis. A thin, light gray line connects these points.
* **Annotations:**
* A vertical red dashed line at x=10.
* Text "Optimization Stop!" in red, italic font, positioned to the right of the red dashed line, near the bottom of the chart.
* Text "Average" in black, positioned near the top-right of the chart area, above the gray data points.
**Table Area (Right Side):**
* **Title:** "Latency Breakdown per Token"
| Modules | Latency (ms) | Ratio (%) |
|---------|--------------|-----------|
| Optimize | 0.24 ± 0.02 | 0.8 |
| Draft | 19.93 ± 1.36 | 64.4 |
| Verify | 8.80 ± 2.21 | 28.4 |
| Others | 1.98 ± 0.13 | 6.4 |
| Total | 30.95 ± 2.84 | 100.0 |
### Detailed Analysis
**Chart Trends and Data Points:**
* **Matchness (Blue Line):** Shows a steep, near-linear increase from approximately 0.45 at 0 instances to about 0.95 at 10 instances. After the "Optimization Stop!" line (x=10), the trend plateaus, fluctuating slightly between ~0.95 and 1.0 for the remainder of the instances (10 to 100).
* **Overall Speedup (Green Line):** Exhibits a steady, logarithmic-like increase. It starts at approximately 1.25 at 0 instances, crosses 1.4 around 20 instances, and asymptotically approaches ~1.52 by 100 instances. The shaded green area is widest at the beginning (indicating higher variance) and narrows as the number of instances increases.
* **Instance Speedup (Gray Dots):** The individual data points show significant scatter, especially in the early instances (0-30). The values range from a low of ~1.28 to a high of ~1.58. The connecting gray line reveals high volatility. After the "Optimization Stop!" point, the scatter remains but the average trend aligns closely with the green "Overall Speedup" line. The "Average" label suggests the gray dots represent individual measurements whose mean is tracked by the green line.
* **Key Event:** The vertical red dashed line at x=10, labeled "Optimization Stop!", marks a critical point. After this point, the Matchness metric stabilizes at a high value, while the Speedup metrics continue their gradual improvement.
**Table Data:**
The table provides a precise breakdown of computational latency per token.
* The **"Draft"** module is the dominant contributor, accounting for 64.4% of the total latency (19.93 ± 1.36 ms).
* The **"Verify"** module is the second largest at 28.4% (8.80 ± 2.21 ms).
* **"Optimize"** and **"Others"** are minor contributors, at 0.8% and 6.4% respectively.
* The **Total** latency is 30.95 ± 2.84 ms per token.
### Key Observations
1. **Phase Change at Instance 10:** There is a clear regime shift after 10 instances. The rapid improvement in Matchness halts, suggesting the optimization goal was largely achieved. Speedup continues to improve but at a diminishing rate.
2. **High Initial Variance:** Both the Matchness curve and the Instance Speedup scatter show the greatest change and variability in the first 10-20 instances, indicating an active learning or adaptation phase.
3. **Dominant Latency Component:** The "Draft" module is the primary bottleneck, consuming nearly two-thirds of the total processing time per token.
4. **Correlation of Metrics:** The improvement in Speedup (green line) correlates with the stabilization of high Matchness (blue line) after the optimization stop point, suggesting the system becomes both accurate and efficient.
### Interpretation
This visualization tells the story of an optimization system's training or adaptation process. The "Optimization Stop!" event at 10 instances likely represents a point where a primary objective (high Matchness) was met, after which the system continued to fine-tune for efficiency (Speedup). The high initial variance in Instance Speedup suggests the system was exploring different strategies early on.
The latency table provides crucial context for the "Speedup" metric. The overall speedup (reaching ~1.52x) is achieved despite the "Draft" phase being extremely costly. This implies that the optimization process is successfully reducing the *relative* time spent in other phases or improving the efficiency of the Draft phase itself over instances. The system's value lies in its ability to achieve high matchness quickly (within 10 instances) and then continue to deliver incremental speed improvements, making it suitable for scenarios where rapid initial accuracy is critical, followed by sustained performance gains. The large uncertainty (± values) in the "Verify" and "Total" latency suggests variability in the complexity of the tokens being processed.