## Line Chart: Matchness vs. Number of Instances with Speedup Metrics
### Overview
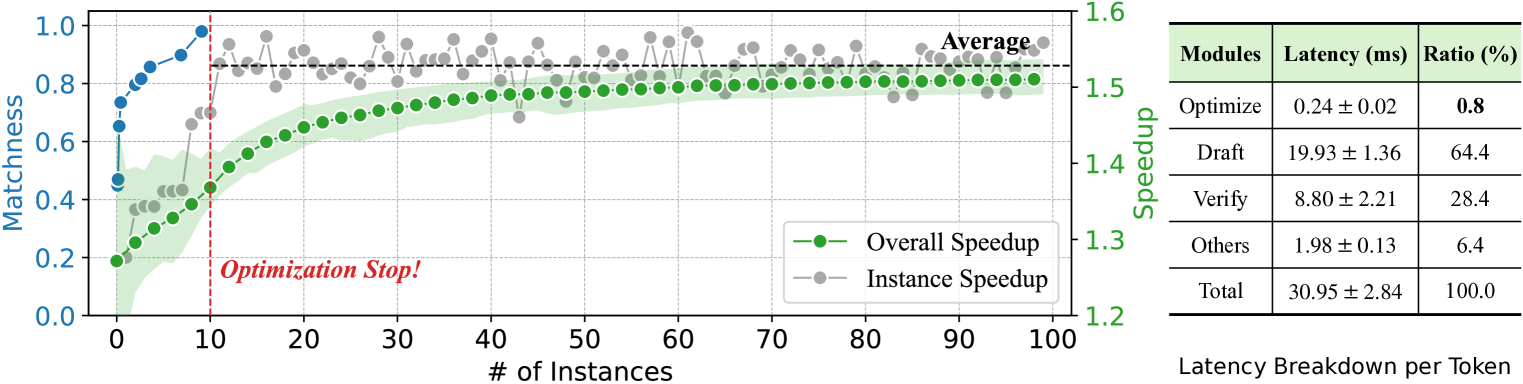
The image contains a line chart comparing "Matchness" and "Speedup" metrics across varying numbers of instances, alongside a latency breakdown table. The chart includes two data series (Overall Speedup and Instance Speedup) and a vertical "Optimization Stop!" marker. The table quantifies latency contributions from different processing modules.
### Components/Axes
**Left Chart (Line Chart):**
- **X-axis**: "# of Instances" (0 to 100, linear scale)
- **Y-axis (Left)**: "Matchness" (0.0 to 1.0, linear scale)
- **Y-axis (Right)**: "Speedup" (1.2 to 1.6, linear scale)
- **Legend**: Located at bottom-right, with:
- Green line/circles: "Overall Speedup"
- Gray line/circles: "Instance Speedup"
- **Annotations**:
- Red dashed vertical line labeled "Optimization Stop!" at x=10
- Horizontal dashed line labeled "Average" at y=0.8 (Matchness)
**Right Table (Latency Breakdown):**
- **Columns**:
- Modules (Optimize, Draft, Verify, Others, Total)
- Latency (ms) with uncertainty (e.g., 0.24 ± 0.02)
- Ratio (%)
- **Rows**:
- Optimize: 0.24 ms (±0.02), 0.8%
- Draft: 19.93 ms (±1.36), 64.4%
- Verify: 8.80 ms (±2.21), 28.4%
- Others: 1.98 ms (±0.13), 6.4%
- Total: 30.95 ms (±2.84), 100%
### Detailed Analysis
**Left Chart Trends:**
1. **Overall Speedup (Green)**:
- Starts at 0.2 (x=0) and rises sharply to 0.8 by x=10.
- Plateaus at 0.8 for x > 10, with minor fluctuations.
- Shaded green area (confidence interval) widens slightly after x=10.
2. **Instance Speedup (Gray)**:
- Begins at 1.2 (x=0) and stabilizes near 1.5 for x > 5.
- Shows minor oscillations but remains above 1.4 throughout.
3. **Key Thresholds**:
- "Optimization Stop!" at x=10 aligns with the plateau in Overall Speedup.
- "Average" Matchness line at y=0.8 intersects the plateau.
**Right Table Data:**
- **Latency Distribution**:
- Draft dominates latency (64.4%) despite low speedup ratio.
- Verify contributes 28.4% latency, 0% speedup ratio.
- Optimize has minimal latency (0.24 ms) but 0.8% ratio.
- Total latency: 30.95 ms (±2.84).
### Key Observations
1. **Chart**:
- Matchness plateaus at 0.8 after 10 instances, suggesting diminishing returns.
- Instance Speedup remains significantly higher than Overall Speedup.
- Confidence intervals for Overall Speedup widen post-optimization stop.
2. **Table**:
- Draft module accounts for 64.4% of latency but contributes 0% to speedup.
- Verify has high latency (8.80 ms) but no speedup impact.
- Optimize has negligible latency but minimal speedup contribution.
### Interpretation
The data reveals a trade-off between latency and speedup optimization:
- **Chart Insights**:
- The "Optimization Stop!" at 10 instances marks the point where further instance scaling yields no Matchness improvement.
- Instance Speedup (1.2–1.5) suggests parallel processing efficiency, while Overall Speedup (0.2–0.8) reflects system-wide performance.
- The widening confidence interval after x=10 implies uncertainty in Matchness gains beyond this threshold.
- **Table Insights**:
- Draft and Verify modules are latency bottlenecks despite their speedup ratios being zero or negligible.
- Optimize’s low latency (0.24 ms) and 0.8% ratio indicate it’s a minor contributor to total processing time.
- Total latency (30.95 ms) is dominated by Draft (19.93 ms) and Verify (8.80 ms), suggesting these modules require optimization for performance gains.
**Critical Anomalies**:
- The "Average" Matchness line (0.8) aligns with the Optimization Stop, implying this is the target threshold.
- Verify’s high latency (8.80 ms) with 0% speedup ratio highlights inefficiency in this module.
- Draft’s 64.4% latency share but 0% speedup ratio suggests it’s a non-parallelizable or critical-path process.
**Conclusion**:
The system achieves optimal Matchness (0.8) at 10 instances, but latency remains concentrated in Draft and Verify modules. Further optimization should focus on reducing Draft/Verify latency, as these dominate total processing time despite their minimal speedup contributions.