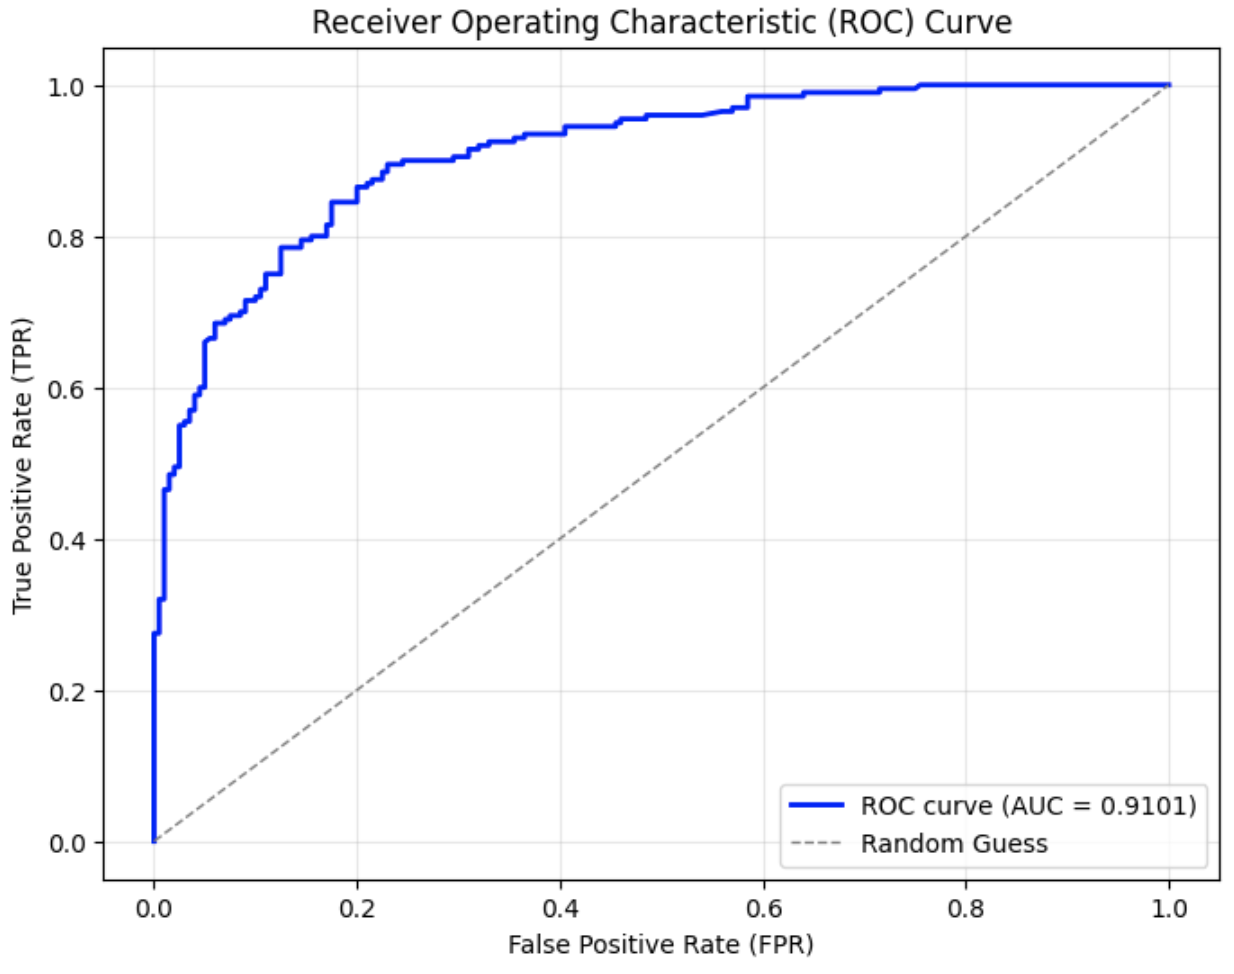
## Chart/Diagram Type: Receiver Operating Characteristic (ROC) Curve
### Overview
The image displays a Receiver Operating Characteristic (ROC) curve, a graphical plot that illustrates the diagnostic ability of a binary classifier system. The curve compares the trade-off between the True Positive Rate (TPR) and the False Positive Rate (FPR) at various threshold settings. A secondary dashed line represents a "Random Guess" baseline for comparison.
### Components/Axes
- **X-Axis**: Labeled "False Positive Rate (FPR)" with values ranging from 0.0 to 1.0 in increments of 0.1.
- **Y-Axis**: Labeled "True Positive Rate (TPR)" with values ranging from 0.0 to 1.0 in increments of 0.1.
- **Legend**: Located in the bottom-right corner, containing two entries:
- **Blue Solid Line**: "ROC curve (AUC = 0.9101)"
- **Gray Dashed Line**: "Random Guess"
- **Gridlines**: Horizontal and vertical gridlines at 0.0, 0.2, 0.4, 0.6, 0.8, and 1.0 for both axes.
### Detailed Analysis
- **ROC Curve (Blue Solid Line)**:
- Starts at (0.0, 0.0) and rises sharply to (0.05, 0.3), then gradually increases to (0.1, 0.6), (0.2, 0.8), (0.3, 0.9), (0.4, 0.95), (0.5, 0.97), (0.6, 0.98), (0.7, 0.99), (0.8, 0.995), (0.9, 0.998), and ends at (1.0, 1.0).
- The curve exhibits a steep initial ascent, followed by a plateau near the top-right corner, indicating high TPR even as FPR increases.
- **Random Guess Line (Gray Dashed Line)**:
- A straight diagonal line from (0.0, 0.0) to (1.0, 1.0), representing a baseline performance with no discriminative power.
### Key Observations
1. The ROC curve dominates the upper-right quadrant, demonstrating strong discriminative ability.
2. The AUC (Area Under the Curve) value of 0.9101 suggests excellent model performance, as values closer to 1.0 indicate better classification.
3. The steep initial rise of the ROC curve implies high sensitivity to low FPR thresholds.
4. The plateau near (1.0, 1.0) indicates near-perfect TPR at high FPR values.
### Interpretation
The ROC curve illustrates the model's ability to distinguish between classes effectively. The high AUC value (0.9101) confirms the model's robustness, with the curve consistently outperforming the random guess line. The steep initial ascent highlights the model's sensitivity to low FPR thresholds, while the plateau near the top-right corner suggests that the model maintains high TPR even as FPR increases. This trade-off is critical for applications requiring balanced performance, such as medical diagnostics or fraud detection. The "Random Guess" line serves as a benchmark, emphasizing that the model's performance is significantly better than chance.