## Chart: Receiver Operating Characteristic (ROC) Curve
### Overview
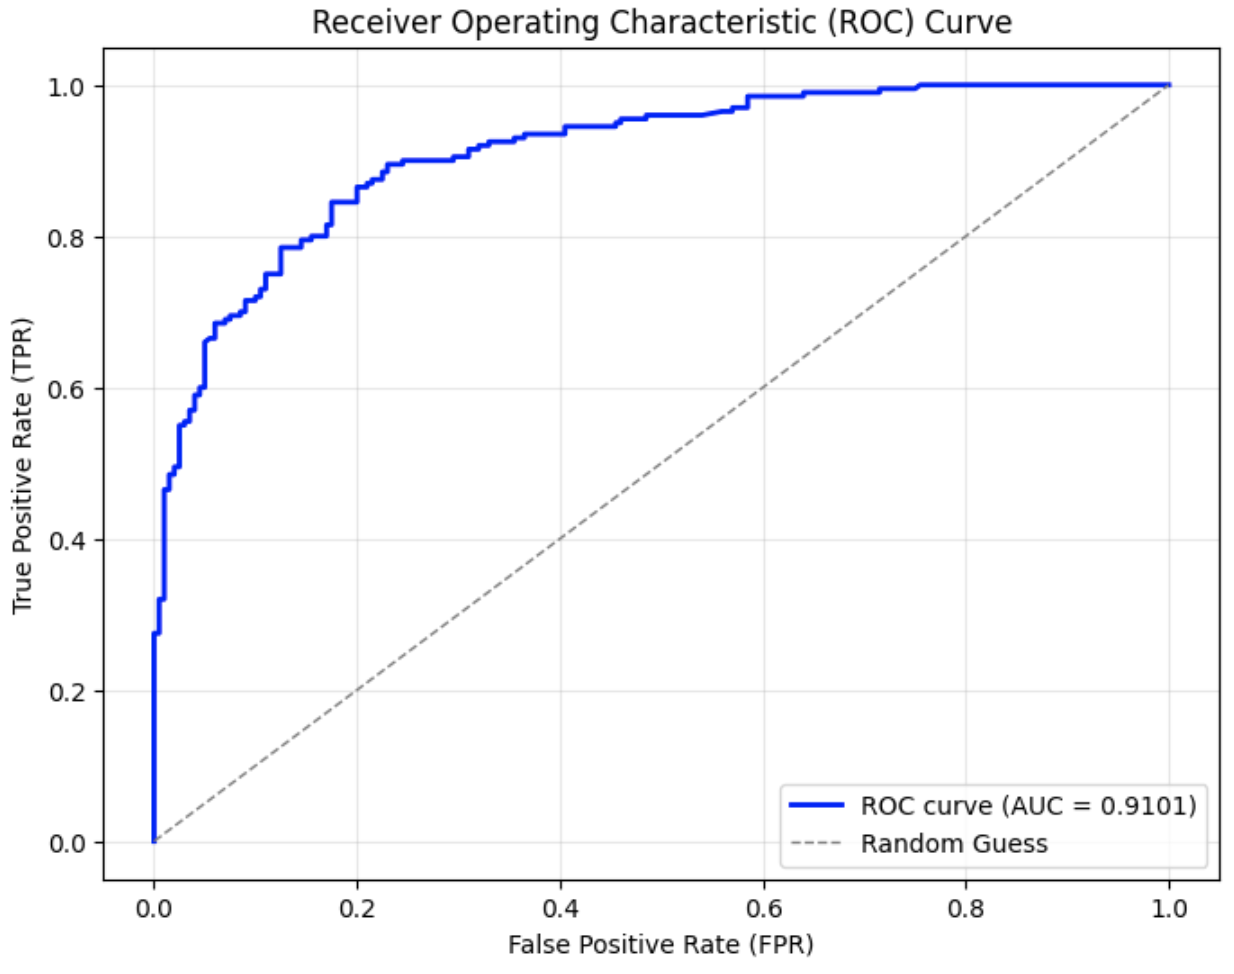
The image is a Receiver Operating Characteristic (ROC) curve, which plots the True Positive Rate (TPR) against the False Positive Rate (FPR). It shows the performance of a classification model. The plot includes the ROC curve of the model and a diagonal line representing random guessing. The Area Under the Curve (AUC) is also provided.
### Components/Axes
* **Title:** Receiver Operating Characteristic (ROC) Curve
* **X-axis:** False Positive Rate (FPR), ranging from 0.0 to 1.0 in increments of 0.2.
* **Y-axis:** True Positive Rate (TPR), ranging from 0.0 to 1.0 in increments of 0.2.
* **Legend (bottom-right):**
* Blue solid line: ROC curve (AUC = 0.9101)
* Gray dashed line: Random Guess
### Detailed Analysis
* **ROC Curve (Blue):** The blue ROC curve starts at (0.0, 0.0) and rises sharply, indicating a high true positive rate at low false positive rates. It reaches a TPR of approximately 0.7 at an FPR of 0.1. The curve continues to rise, but at a slower rate, approaching a TPR of 1.0 as the FPR approaches 1.0. The curve has a generally upward trend with some horizontal segments.
* (0.0, 0.0)
* (0.02, 0.5)
* (0.05, 0.6)
* (0.1, 0.75)
* (0.2, 0.85)
* (0.3, 0.9)
* (0.4, 0.93)
* (0.6, 0.97)
* (0.8, 0.99)
* (1.0, 1.0)
* **Random Guess (Gray Dashed):** The gray dashed line represents a random guess, where the TPR equals the FPR. It is a diagonal line from (0.0, 0.0) to (1.0, 1.0).
### Key Observations
* The ROC curve is significantly above the random guess line, indicating that the model performs much better than random chance.
* The AUC is 0.9101, which is close to 1.0, indicating excellent performance of the classification model.
* The curve rises steeply at the beginning, showing that the model can achieve a high true positive rate with a low false positive rate.
### Interpretation
The ROC curve and the AUC value suggest that the classification model has a high ability to discriminate between positive and negative classes. The model is effective at correctly identifying positive cases while minimizing false positives. The AUC of 0.9101 indicates that there is a 91.01% chance that the model will be able to distinguish between positive and negative classes. The steep initial rise of the ROC curve suggests that the model is particularly good at identifying true positives early on, which is a desirable characteristic in many applications.