## Line Chart: Time vs. Search Space Size with N
### Overview
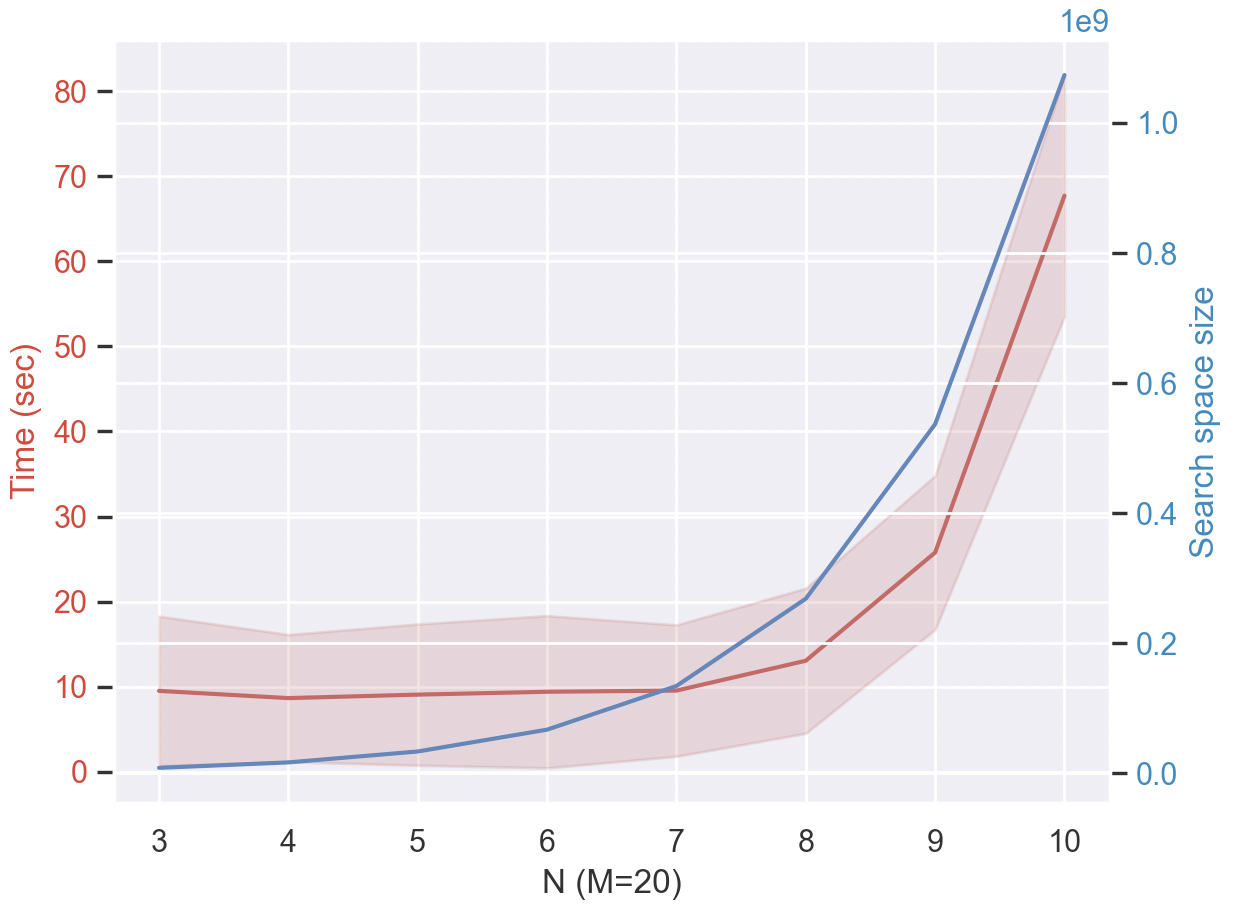
This image presents a line chart illustrating the relationship between 'N' (with a fixed M=20) and two dependent variables: 'Time (sec)' and 'Search space size'. The chart displays the trends of these variables as 'N' increases from 3 to 10. Both variables are plotted with confidence intervals represented by shaded areas.
### Components/Axes
* **X-axis:** Labeled "N (M=20)", ranging from 3 to 10.
* **Left Y-axis:** Labeled "Time (sec)", ranging from 0 to 80.
* **Right Y-axis:** Labeled "Search space size", ranging from 0 to 1e9 (1 billion).
* **Blue Line:** Represents 'Time (sec)' with a shaded confidence interval.
* **Red Line:** Represents 'Search space size' with a shaded confidence interval.
* **Legend:** No explicit legend is present, but the colors are consistently used throughout the chart.
### Detailed Analysis
**Time (sec) - Blue Line:**
The blue line representing 'Time (sec)' shows an increasing trend as 'N' increases. Initially, the time remains relatively constant between N=3 and N=7, fluctuating around approximately 8 seconds. From N=7 onwards, the time increases more rapidly, reaching approximately 75 seconds at N=10. The shaded area around the line indicates a confidence interval, which widens as 'N' increases, suggesting greater uncertainty in the time measurements at higher 'N' values.
* N=3: Time ≈ 8 sec
* N=4: Time ≈ 8 sec
* N=5: Time ≈ 7 sec
* N=6: Time ≈ 9 sec
* N=7: Time ≈ 11 sec
* N=8: Time ≈ 20 sec
* N=9: Time ≈ 45 sec
* N=10: Time ≈ 75 sec
**Search space size - Red Line:**
The red line representing 'Search space size' also exhibits an increasing trend with 'N'. The increase is more pronounced than that of 'Time (sec)'. The search space size starts at approximately 0.1e9 at N=3 and increases to approximately 0.9e9 at N=10. The confidence interval around the red line also widens with increasing 'N', indicating greater uncertainty in the search space size estimation at higher 'N' values.
* N=3: Search space size ≈ 0.1e9
* N=4: Search space size ≈ 0.1e9
* N=5: Search space size ≈ 0.1e9
* N=6: Search space size ≈ 0.2e9
* N=7: Search space size ≈ 0.3e9
* N=8: Search space size ≈ 0.5e9
* N=9: Search space size ≈ 0.7e9
* N=10: Search space size ≈ 0.9e9
### Key Observations
* Both 'Time (sec)' and 'Search space size' increase with 'N'.
* The 'Search space size' increases at a faster rate than 'Time (sec)'.
* The confidence intervals for both variables widen as 'N' increases, indicating greater variability or uncertainty in the measurements at higher 'N' values.
* The initial plateau in 'Time (sec)' between N=3 and N=7 suggests a phase where increasing 'N' does not significantly impact the computation time.
### Interpretation
The chart demonstrates a clear relationship between the parameter 'N' (with a fixed 'M=20') and the computational cost, as measured by 'Time (sec)' and the complexity of the problem, as represented by 'Search space size'. The increasing trends suggest that as 'N' grows, the algorithm requires more time and explores a larger search space. The faster growth of 'Search space size' compared to 'Time (sec)' indicates that the computational cost is not solely determined by the size of the search space; other factors, such as the algorithm's efficiency, also play a role. The widening confidence intervals at higher 'N' values could be due to increased computational complexity or limitations in the measurement process. The initial plateau in 'Time (sec)' might represent a regime where the algorithm can efficiently handle increasing 'N' values without a significant performance penalty, but beyond a certain point (around N=7), the computational cost begins to escalate rapidly. This suggests a potential trade-off between increasing 'N' and maintaining acceptable performance.