## Line Graph: Time and Search Space Size vs. N (M=20)
### Overview
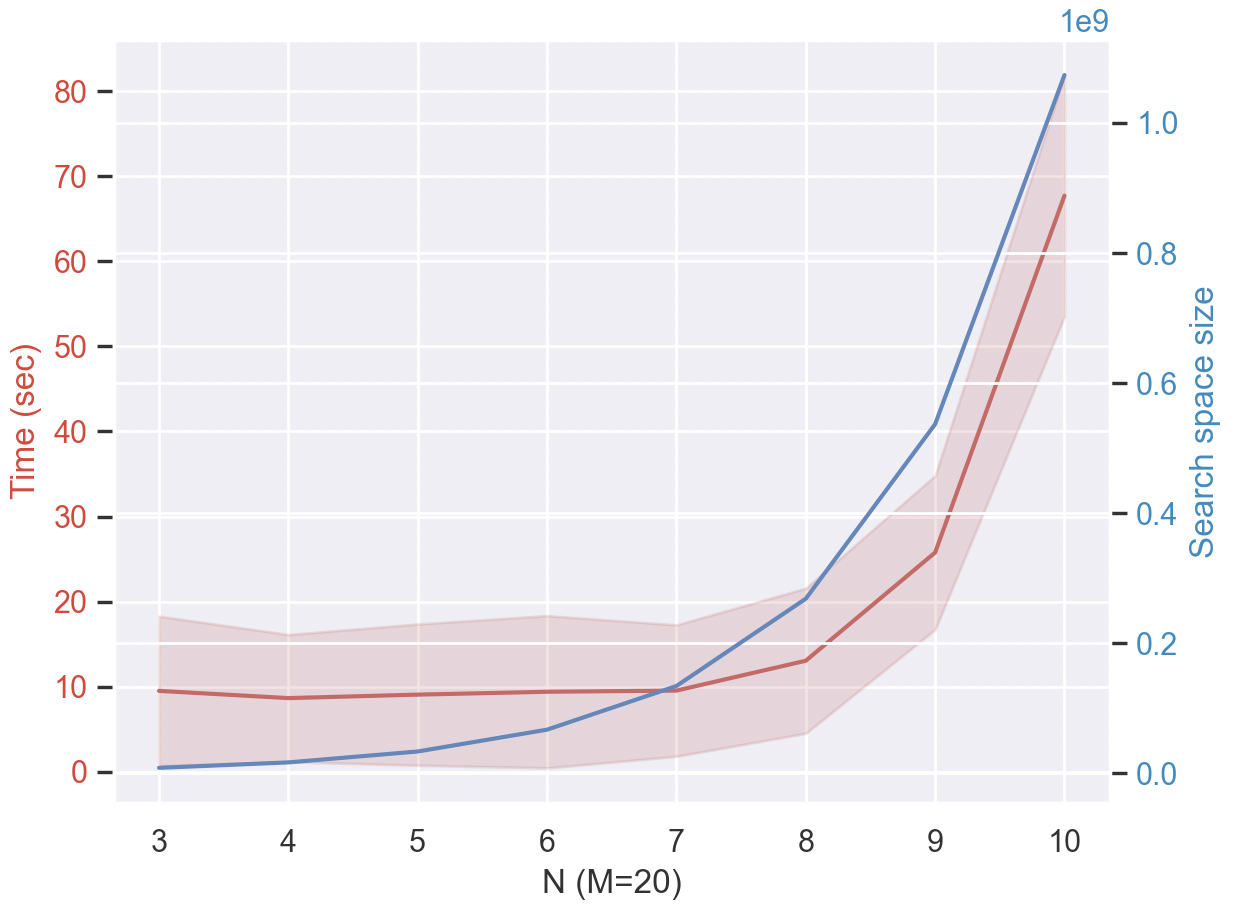
The image is a line graph comparing two metrics—**Time (seconds)** and **Search space size**—as a function of **N (M=20)**, where N ranges from 3 to 10. The graph includes two data series: a blue line for "Search space size" and a red line for "Time (sec)". A secondary y-axis on the right represents the search space size, while the primary y-axis on the left represents time. The legend is positioned in the top-right corner.
---
### Components/Axes
- **X-axis**: Labeled "N (M=20)", with integer values from 3 to 10.
- **Primary Y-axis (left)**: Labeled "Time (sec)", scaled from 0 to 80 in increments of 10.
- **Secondary Y-axis (right)**: Labeled "Search space size", scaled from 0 to 1.0 in increments of 0.2.
- **Legend**: Located in the top-right corner, with:
- **Blue line**: "Search space size"
- **Red line**: "Time (sec)"
---
### Detailed Analysis
#### Search Space Size (Blue Line)
- **Trend**: The blue line shows a **steady upward trend** from N=3 to N=10.
- At N=3: ~0.0 (search space size).
- At N=8: ~0.4.
- At N=10: ~1.0.
- **Key Behavior**: The slope increases sharply after N=8, indicating exponential growth in search space size as N approaches 10.
#### Time (Red Line)
- **Trend**: The red line remains **relatively flat** until N=9, then rises sharply.
- At N=3–8: ~10 seconds (stable).
- At N=9: ~30 seconds.
- At N=10: ~70 seconds.
- **Key Behavior**: A **critical threshold** at N=9, where time increases by ~200% compared to N=8.
---
### Key Observations
1. **Divergence at N=9**: Both metrics show a sharp increase at N=9, suggesting a phase transition or computational bottleneck.
2. **Search Space vs. Time**: The search space size grows exponentially (blue line), while time remains low until N=9, then scales linearly (red line).
3. **Uncertainty**: Values are approximate due to the absence of gridlines or exact data points. For example:
- Time at N=10: ~70 seconds (could range from 65–75).
- Search space size at N=10: ~1.0 (could range from 0.9–1.1).
---
### Interpretation
The graph highlights a **non-linear relationship** between problem complexity (N) and computational cost. While the search space size grows exponentially with N, the time complexity remains manageable until N=9, after which both metrics escalate sharply. This suggests that the algorithm’s performance is **asymptotically stable** for smaller N but becomes **intractable** beyond a critical threshold (N=9). The divergence at N=9 may indicate a combinatorial explosion or a shift in the problem’s structure, requiring further investigation into optimization strategies or algorithmic efficiency.