TECHNICAL ASSET FINGERPRINT
684c1e345fac7abf70bc7a34
Click to view fullscreen
Press ESC or click to close
FOUND IN PAPERS
EXPERT: gemini-2.5-flash-free VERSION 1
RUNTIME: google-free/gemini-2.5-flash
INTEL_VERIFIED
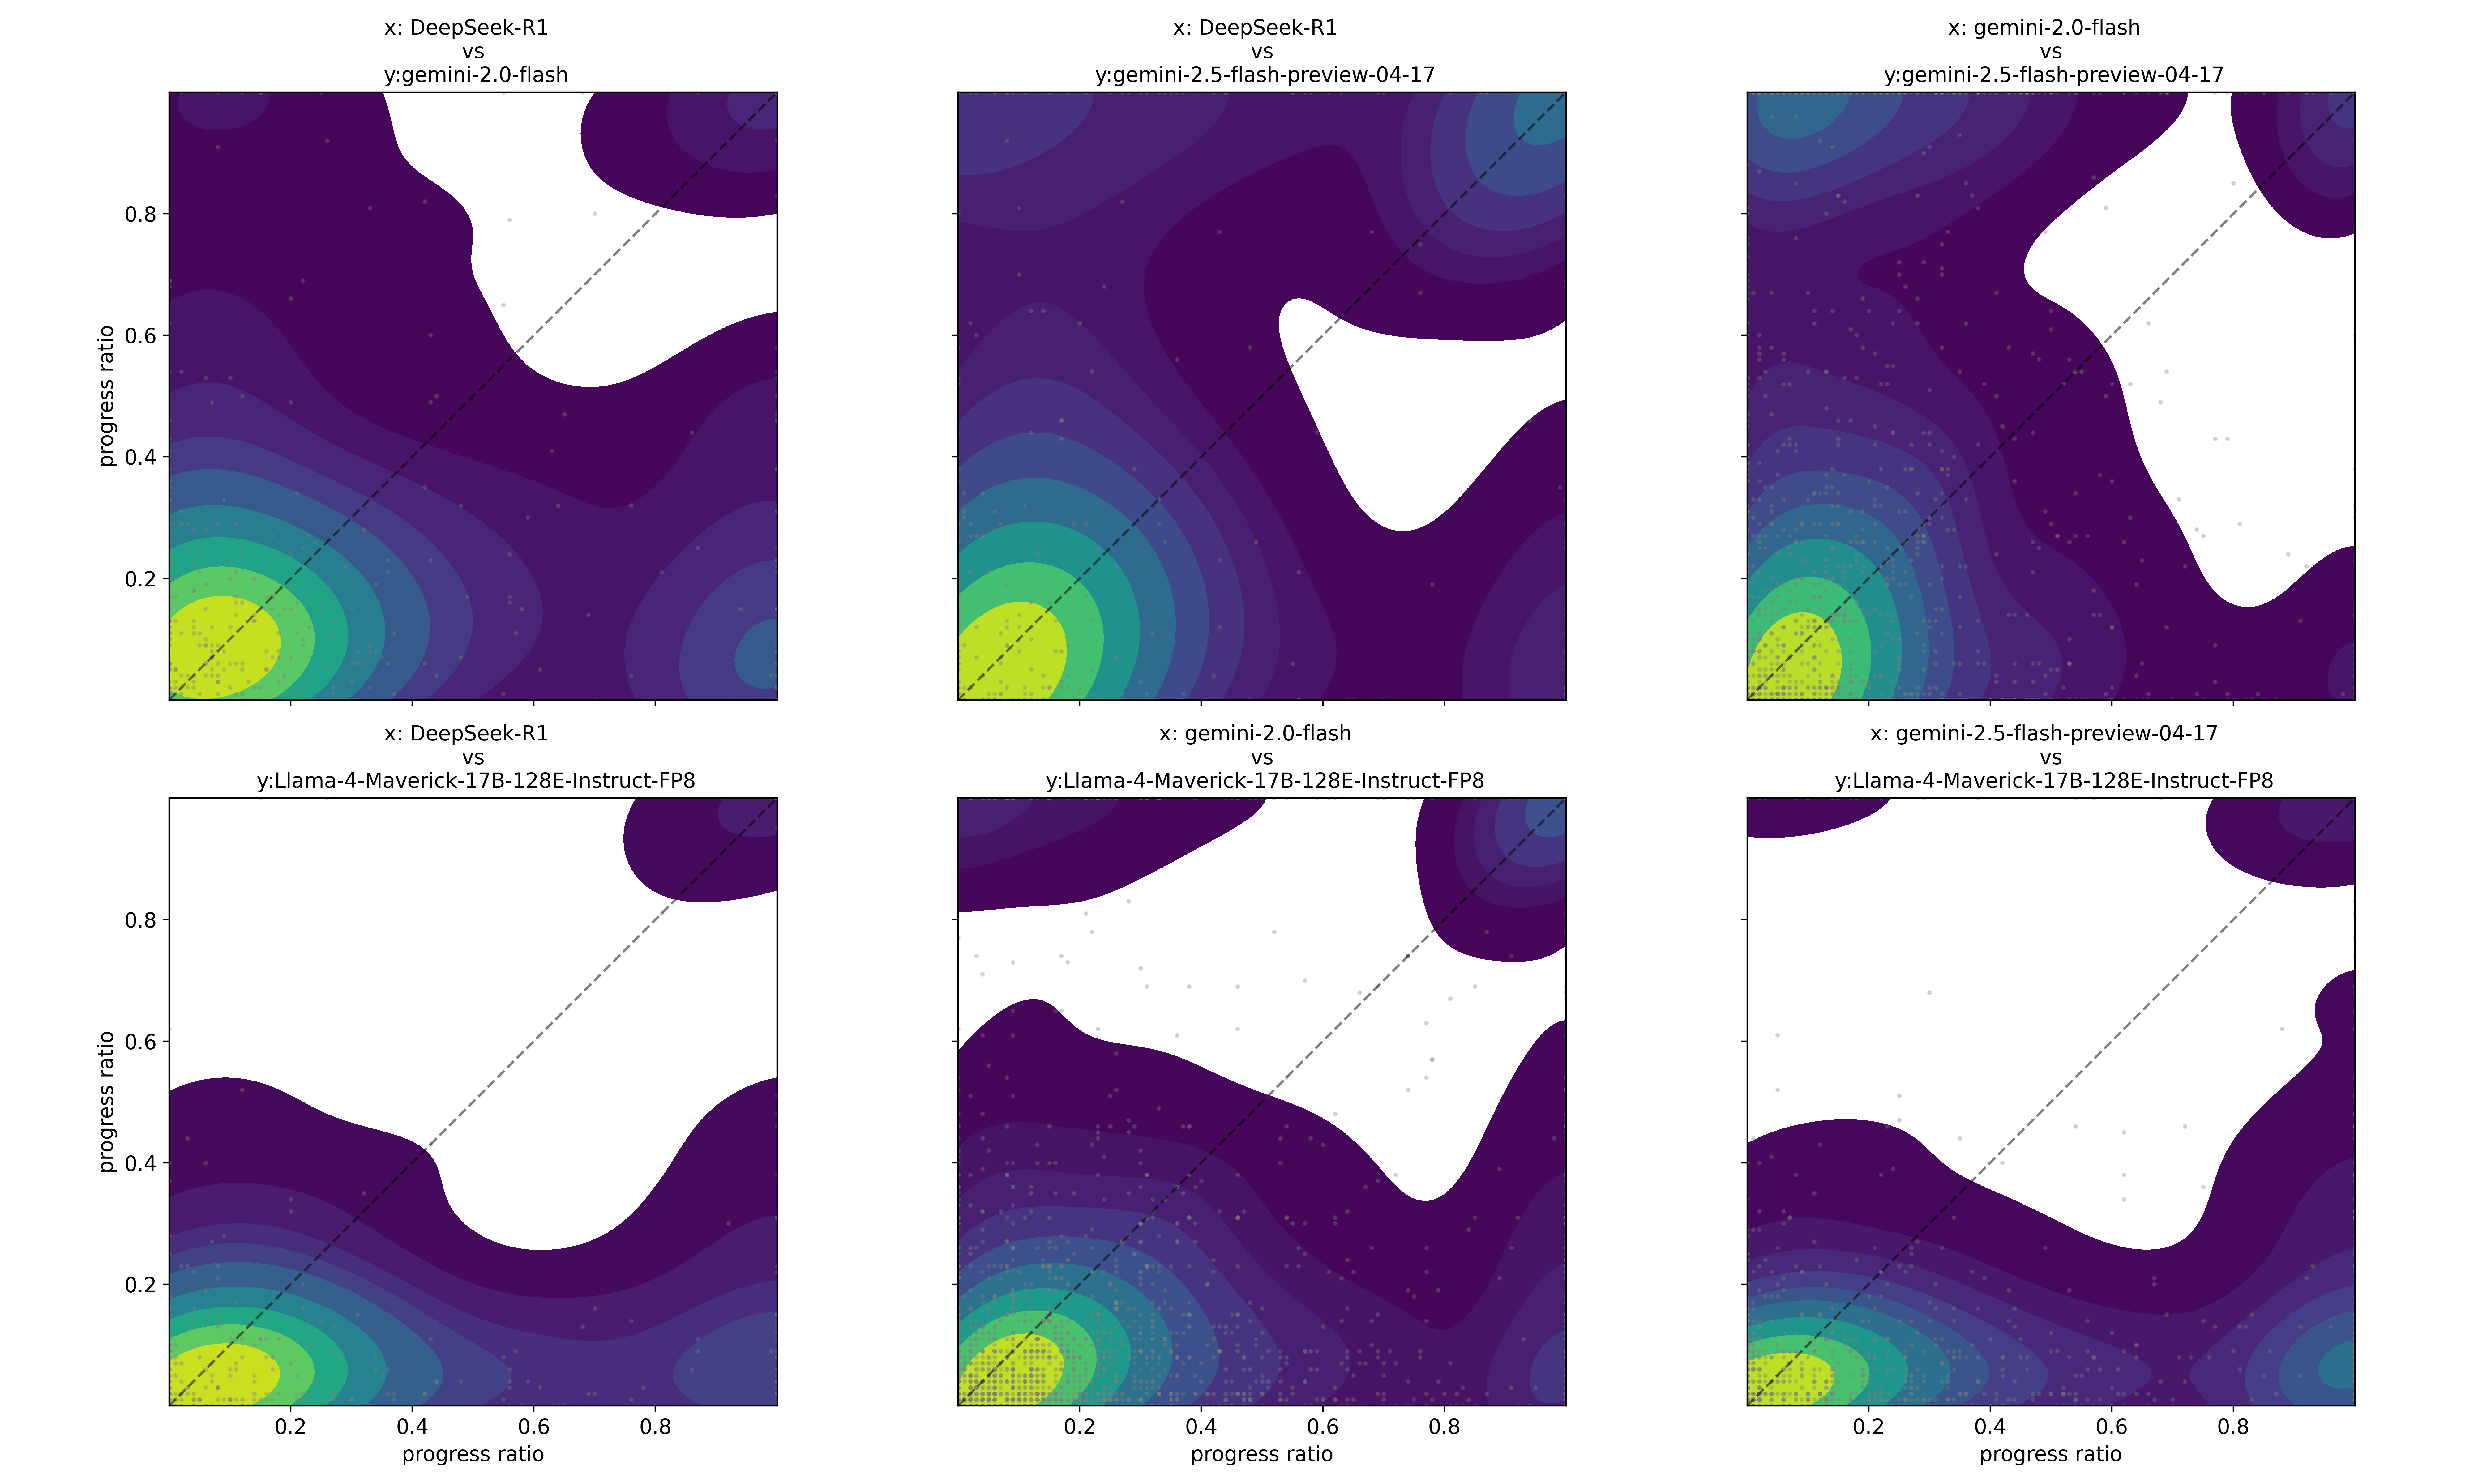
## Chart Type: Grid of 2D Density Contour Plots Comparing Model Progress Ratios
### Overview
This image displays a 2x3 grid of six individual contour plots, each comparing the "progress ratio" of two different language models or model versions. Each subplot visualizes the joint distribution of progress ratios for a pair of models, with contours indicating data density and scattered points representing individual data instances. A dashed diagonal line (y=x) is present in all plots, signifying equal performance between the two models being compared. The color scheme ranges from dark purple (lowest density) to bright yellow/green (highest density), with white areas indicating regions of zero or near-zero data density.
### Components/Axes
The entire grid shares common axis labels and ranges:
* **X-axis Label (bottom-most plot)**: `progress ratio`
* **Y-axis Label (left-most plots)**: `progress ratio`
* **Axis Range**: Both X and Y axes range from 0.0 to 1.0.
* **Major Tick Markers**: 0.2, 0.4, 0.6, 0.8.
* **Diagonal Line**: A dashed grey line extends from (0.0, 0.0) to (1.0, 1.0) in all plots, representing the line of equality (x=y).
* **Data Points**: Small, light grey dots are scattered across each plot, representing individual data instances.
* **Contour Colors**: A continuous color gradient is used to represent data density, typically a viridis-like colormap:
* Dark purple: Lowest density
* Blue/Cyan: Low to medium density
* Green: Medium to high density
* Yellow/Lime Green: Highest density
* White: Zero or extremely low density (no data points observed in these regions).
Each subplot has a unique title indicating the models being compared:
* **Top Row, Left Plot (R1C1)**: `x: DeepSeek-R1 vs y:gemini-2.0-flash`
* **Top Row, Middle Plot (R1C2)**: `x: DeepSeek-R1 vs y:gemini-2.5-flash-preview-04-17`
* **Top Row, Right Plot (R1C3)**: `x: gemini-2.0-flash vs y:gemini-2.5-flash-preview-04-17`
* **Bottom Row, Left Plot (R2C1)**: `x: DeepSeek-R1 vs y:Llama-4-Maverick-17B-128E-Instruct-FP8`
* **Bottom Row, Middle Plot (R2C2)**: `x: gemini-2.0-flash vs y:Llama-4-Maverick-17B-128E-Instruct-FP8`
* **Bottom Row, Right Plot (R2C3)**: `x: gemini-2.5-flash-preview-04-17 vs y:Llama-4-Maverick-17B-128E-Instruct-FP8`
### Detailed Analysis
The analysis is segmented by the 2x3 grid layout:
**Row 1: Comparisons involving DeepSeek-R1 and Gemini models**
* **R1C1: x: DeepSeek-R1 vs y:gemini-2.0-flash**
* **Trend**: The highest density (bright yellow/green) is concentrated in the bottom-left corner, centered approximately around (0.15, 0.15). The density gradually decreases outwards, forming concentric contours. A secondary, much less intense, and smaller density peak is visible in the top-right, around (0.8, 0.9). A significant white region, indicating no data, is present in the upper-middle part of the plot, roughly from (0.4, 0.5) to (0.8, 0.7), and also in the top-right corner above the secondary peak.
* **Data Points**: Numerous grey scattered points are densest in the bottom-left, following the yellow/green contour, and sparser elsewhere, consistent with the contour map. Most points are clustered near the y=x line in the bottom-left.
* **R1C2: x: DeepSeek-R1 vs y:gemini-2.5-flash-preview-04-17**
* **Trend**: This plot shows a very similar distribution to R1C1. The highest density is in the bottom-left corner, centered around (0.15, 0.15). Density decreases outwards. A large white region is prominent in the middle-right, extending from approximately (0.4, 0.5) to (0.8, 0.7), and another smaller white region in the top-right. There is no clear secondary peak in the top-right as seen in R1C1.
* **Data Points**: Grey scattered points are most concentrated in the bottom-left, aligning with the high-density contours.
* **R1C3: x: gemini-2.0-flash vs y:gemini-2.5-flash-preview-04-17**
* **Trend**: The distribution here is almost identical to R1C2. The highest density is in the bottom-left corner, centered around (0.15, 0.15). Density decreases outwards. A large white region is present in the middle-right, extending from approximately (0.4, 0.5) to (0.8, 0.7), and another smaller white region in the top-right.
* **Data Points**: Grey scattered points are most concentrated in the bottom-left, aligning with the high-density contours.
**Row 2: Comparisons involving Llama-4-Maverick-17B-128E-Instruct-FP8**
* **R2C1: x: DeepSeek-R1 vs y:Llama-4-Maverick-17B-128E-Instruct-FP8**
* **Trend**: This plot exhibits a bimodal distribution. A primary high-density area (yellow/green) is in the bottom-left corner, centered around (0.15, 0.15). A secondary, distinct high-density area (yellow/green) is located in the top-right corner, centered around (0.9, 0.9). Both peaks are centered on the y=x line. A large, irregular white region forms a diagonal band across the middle of the plot, roughly from (0.3, 0.4) to (0.7, 0.8), indicating a lack of data points in this intermediate progress ratio range.
* **Data Points**: Grey scattered points are densely clustered in both the bottom-left and top-right corners, corresponding to the high-density contours.
* **R2C2: x: gemini-2.0-flash vs y:Llama-4-Maverick-17B-128E-Instruct-FP8**
* **Trend**: The distribution is very similar to R2C1. A primary high-density area is in the bottom-left corner, centered around (0.15, 0.15). A secondary high-density area is in the top-right corner, centered around (0.9, 0.9). Both peaks are centered on the y=x line. A large, irregular white region forms a diagonal band across the middle, roughly from (0.3, 0.4) to (0.7, 0.8).
* **Data Points**: Grey scattered points are densely clustered in both the bottom-left and top-right corners.
* **R2C3: x: gemini-2.5-flash-preview-04-17 vs y:Llama-4-Maverick-17B-128E-Instruct-FP8**
* **Trend**: The distribution is nearly identical to R2C1 and R2C2. A primary high-density area is in the bottom-left corner, centered around (0.15, 0.15). A secondary high-density area is in the top-right corner, centered around (0.9, 0.9). Both peaks are centered on the y=x line. A large, irregular white region forms a diagonal band across the middle, roughly from (0.3, 0.4) to (0.7, 0.8).
* **Data Points**: Grey scattered points are densely clustered in both the bottom-left and top-right corners.
### Key Observations
1. **Common Low Performance**: All six plots show a significant concentration of data points and high density in the bottom-left corner (progress ratio < 0.2 for both models). This suggests that for a substantial number of instances, all compared models achieve a very low "progress ratio".
2. **Equality Line Adherence**: In all plots, the high-density regions are generally centered on or very close to the y=x dashed line, indicating that when one model performs well (or poorly), the other model in the pair tends to perform similarly for those specific instances.
3. **Top Row vs. Bottom Row Differences**:
* **Top Row (DeepSeek-R1 vs Gemini, Gemini 2.0 vs Gemini 2.5)**: These plots are characterized by a strong bottom-left peak and a large, contiguous white region in the middle-to-upper-right quadrant. This implies a lack of instances where both models achieve moderate to high progress ratios, or where one significantly outperforms the other in the higher range.
* **Bottom Row (All models vs Llama-4-Maverick)**: These plots show a distinct bimodal distribution with high-density peaks in both the bottom-left and top-right corners. This indicates that for many instances, both models either achieve very low progress ratios *or* very high progress ratios.
4. **Intermediate Performance Gap (Bottom Row)**: The prominent white diagonal band in the middle of the bottom row plots (roughly 0.3 to 0.8 progress ratio) suggests that there are very few instances where both models achieve intermediate progress ratios.
5. **Consistency within Rows**: The plots within the top row are very similar to each other, as are the plots within the bottom row. This suggests that DeepSeek-R1, Gemini 2.0-flash, and Gemini 2.5-flash-preview-04-17 have comparable performance profiles when evaluated against each other (top row) and when evaluated against Llama-4-Maverick-17B-128E-Instruct-FP8 (bottom row).
### Interpretation
The "progress ratio" appears to be a metric where higher values indicate better performance. The plots are essentially comparing the performance of different models on a set of tasks or instances.
The consistent high density in the bottom-left corner across all plots suggests that a significant portion of the evaluated instances are challenging for all models, resulting in low progress ratios. This could indicate a baseline difficulty for the tasks or a common failure mode.
The top row plots, comparing DeepSeek-R1 with Gemini models and Gemini 2.0 with Gemini 2.5, show that while there are many instances of low performance, there are fewer instances where both models achieve moderate to high progress ratios. The large white region in the middle-right suggests that these model pairs rarely achieve high progress ratios simultaneously, or that one model rarely achieves a high progress ratio while the other achieves a moderate one. The similarity between R1C2 and R1C3 implies that DeepSeek-R1 and Gemini 2.0-flash have similar performance characteristics when compared to Gemini 2.5-flash-preview-04-17.
In contrast, the bottom row plots, comparing DeepSeek-R1, Gemini 2.0-flash, and Gemini 2.5-flash-preview-04-17 against Llama-4-Maverick-17B-128E-Instruct-FP8, reveal a different pattern. The bimodal distribution with peaks at both low and high progress ratios suggests that for these comparisons, the tasks tend to be either very easy (both models succeed with high progress ratios) or very difficult (both models fail with low progress ratios). The absence of data in the intermediate range (the white diagonal band) implies that there are few tasks where both models achieve a "medium" level of success. This could indicate a binary nature of success for these tasks when evaluated against Llama-4-Maverick, or that the tasks are not finely graded in terms of difficulty for these model pairs. The strong alignment of both peaks with the y=x line indicates that when one model performs well or poorly, Llama-4-Maverick tends to perform similarly on those specific instances. The striking similarity across all three bottom row plots further reinforces that DeepSeek-R1, Gemini 2.0-flash, and Gemini 2.5-flash-preview-04-17 exhibit very similar performance profiles when benchmarked against Llama-4-Maverick-17B-128E-Instruct-FP8.
DECODING INTELLIGENCE...