## Heatmap Comparison: Model Performance Analysis
### Overview
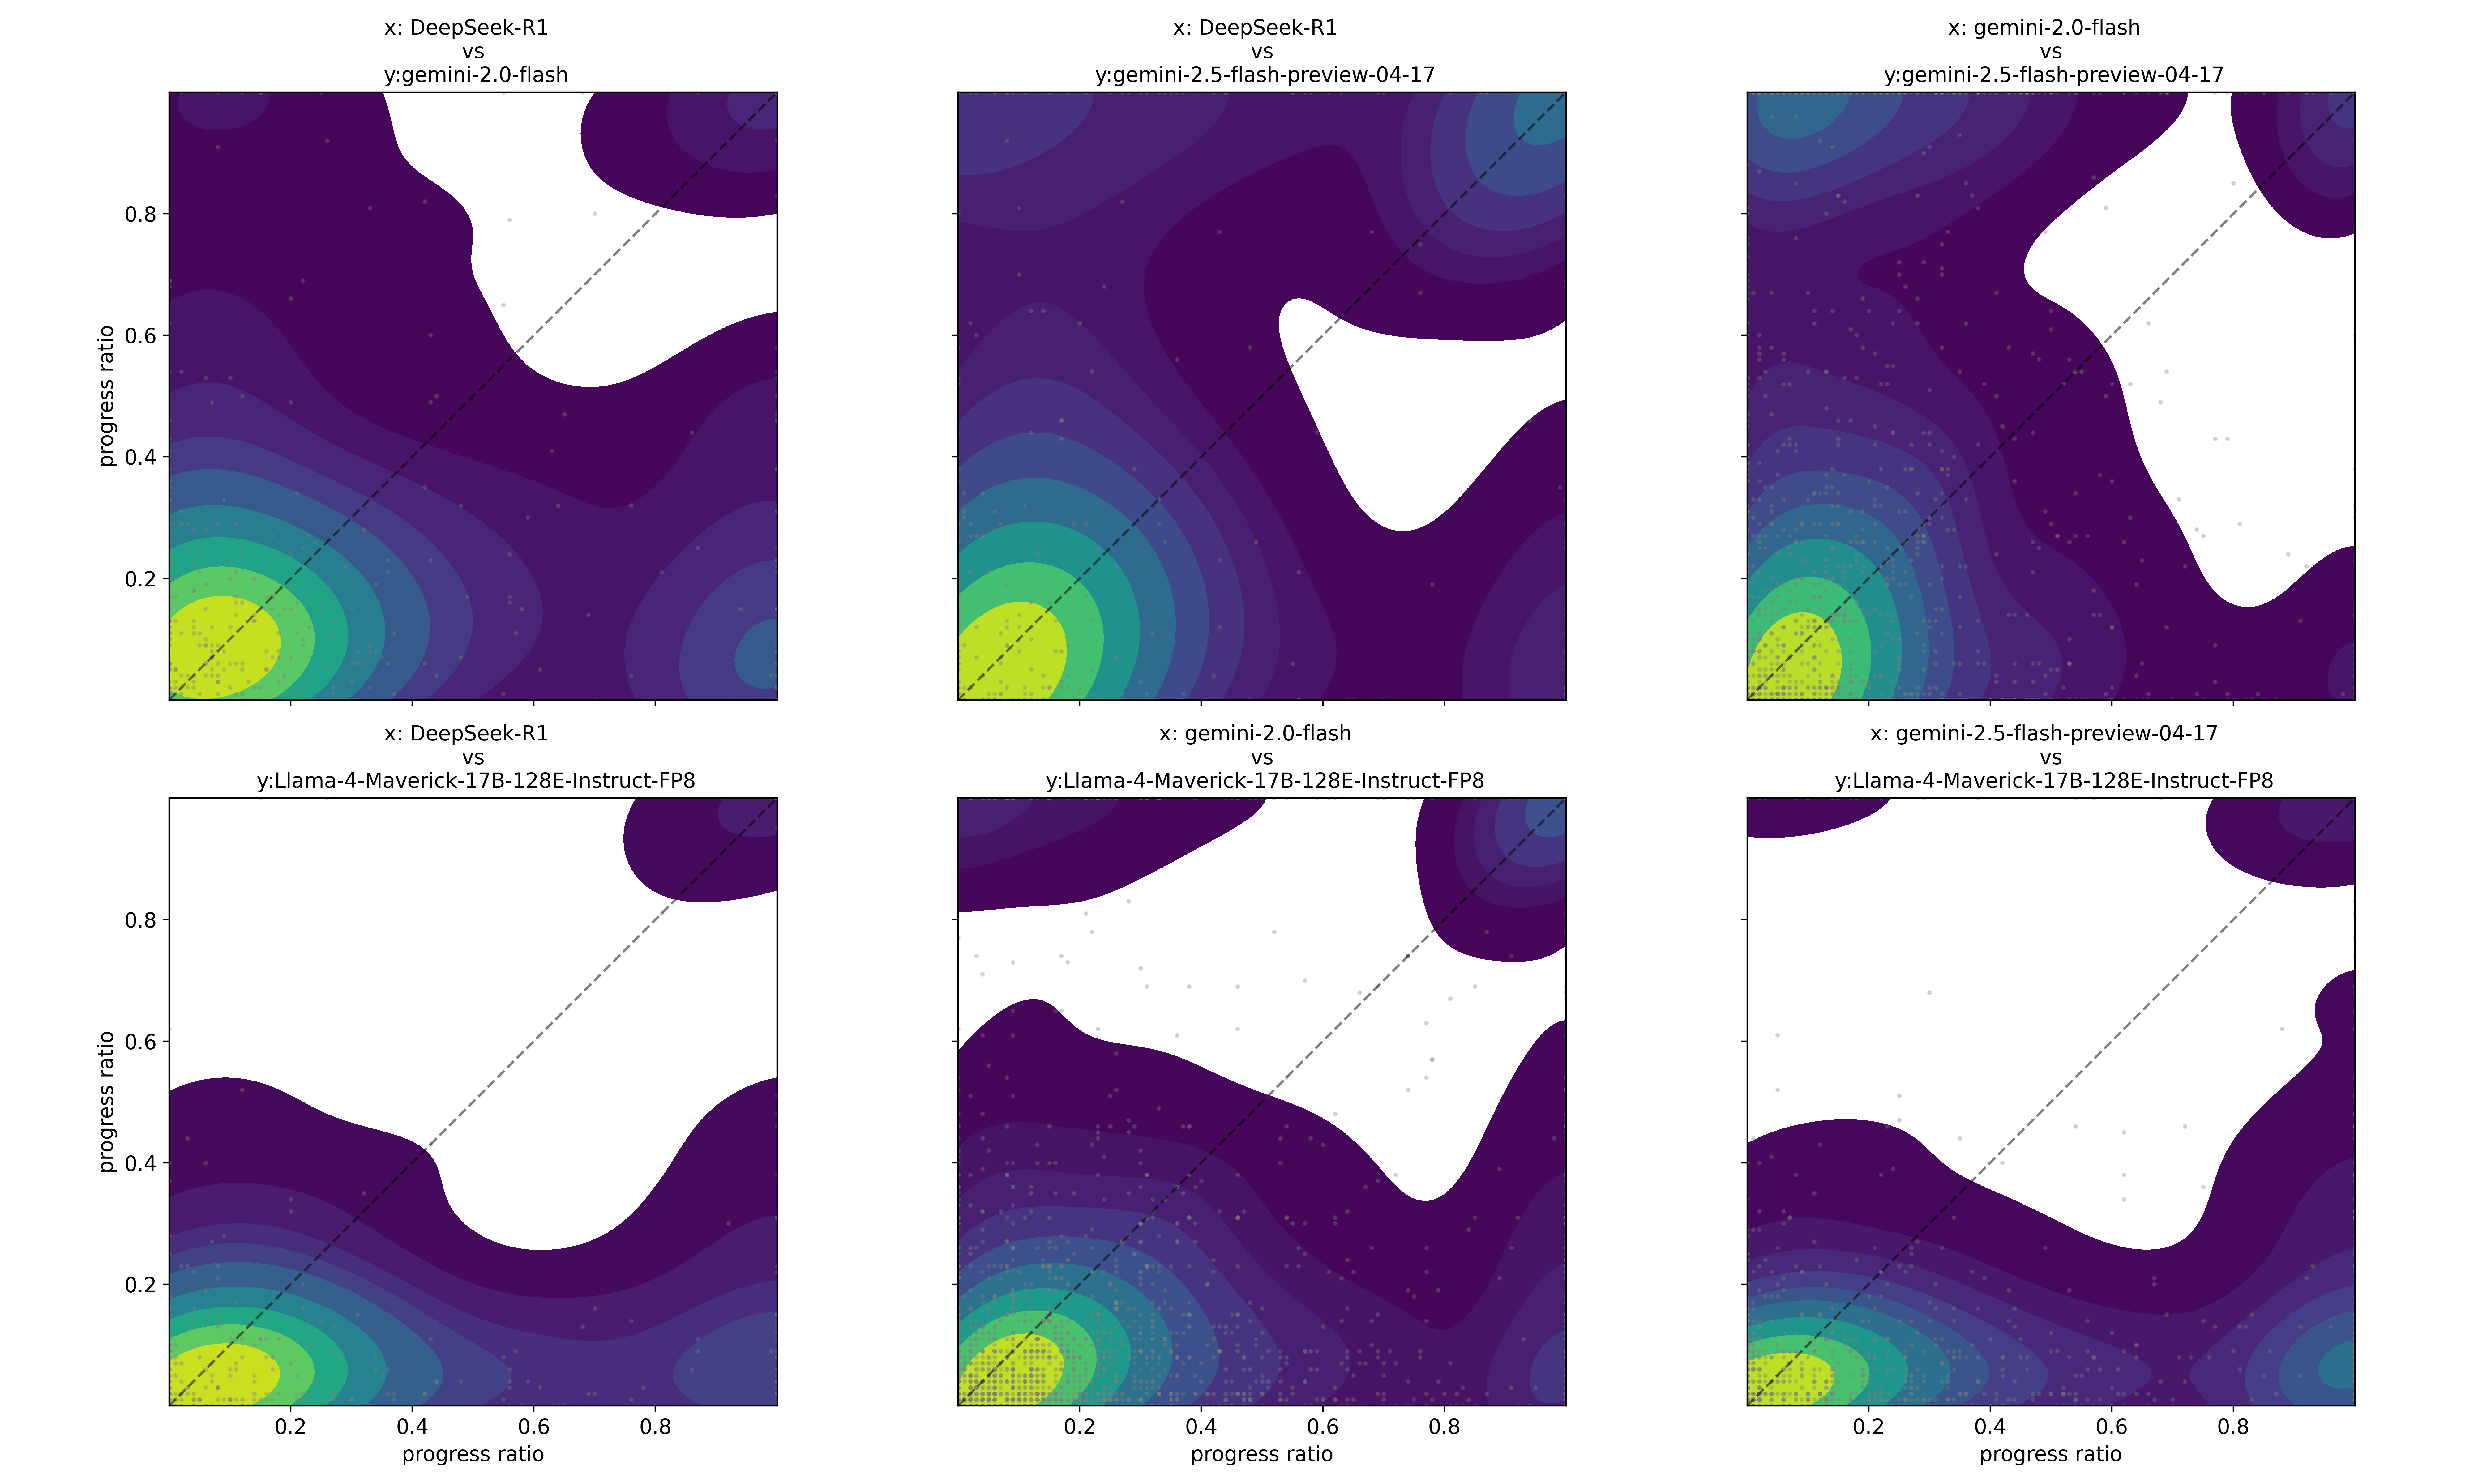
The image contains six comparative heatmaps visualizing performance differences between pairs of AI models across progress ratios. Each plot uses a color gradient (yellow to dark purple) to represent performance levels, with a diagonal dashed line indicating parity. The axes represent progress ratios for two models being compared, with the x-axis labeled as the first model and the y-axis as the second.
### Components/Axes
1. **X-Axis**: Labeled as "progress ratio" for the first model in each comparison (e.g., "DeepSeek-R1", "gemini-2.0-flash", "Llama-4-Maverick-17B-128E-Instruct-FP8").
2. **Y-Axis**: Labeled as "progress ratio" for the second model in each comparison (e.g., "y-gemini-2.0-flash", "y-gemini-2.5-flash-preview-04-17", "y-Llama-4-Maverick-17B-128E-Instruct-FP8").
3. **Diagonal Dashed Line**: Represents parity (equal performance) between the two models.
4. **Color Gradient**:
- Yellow (brightest) indicates regions where the x-axis model significantly outperforms the y-axis model.
- Dark purple indicates regions where the y-axis model dominates.
- Intermediate blues represent moderate performance differences.
- White regions suggest either parity or sparse data.
### Detailed Analysis
1. **Top Row (DeepSeek-R1 vs Gemini Models)**:
- **DeepSeek-R1 vs y-gemini-2.0-flash**:
- Yellow dominance in the bottom-left (x=0.2–0.4, y=0.2–0.4) suggests DeepSeek-R1 performs better at lower progress ratios.
- Dark purple regions in the top-right (x=0.6–0.8, y=0.6–0.8) indicate Gemini-2.0-flash excels at higher progress ratios.
- White regions (x=0.4–0.6, y=0.4–0.6) show parity or transitional performance.
- **DeepSeek-R1 vs y-gemini-2.5-flash-preview-04-17**:
- Similar pattern but with a larger dark purple region in the top-right, indicating Gemini-2.5-flash-preview outperforms more strongly at high progress ratios.
- **gemini-2.0-flash vs y-gemini-2.5-flash-preview-04-17**:
- Yellow dominance in the bottom-left (x=0.2–0.4, y=0.2–0.4) suggests Gemini-2.0-flash performs better at lower progress ratios.
- Dark purple regions in the top-right (x=0.6–0.8, y=0.6–0.8) indicate Gemini-2.5-flash-preview dominates at higher progress ratios.
2. **Bottom Row (Llama-4-Maverick vs Llama-4-Maverick-Instruct-FP8)**:
- **y-Llama-4-Maverick-17B vs y-Llama-4-Maverick-17B-128E-Instruct-FP8**:
- Yellow dominance in the bottom-left (x=0.2–0.4, y=0.2–0.4) indicates the base Llama-4-Maverick model performs better at lower progress ratios.
- Dark purple regions in the top-right (x=0.6–0.8, y=0.6–0.8) show the Instruct-FP8 variant excels at higher progress ratios.
- White regions (x=0.4–0.6, y=0.4–0.6) suggest parity or transitional performance.
### Key Observations
1. **Performance Trends**:
- Models generally show a "sweet spot" where they outperform others at specific progress ratios (e.g., lower ratios for base models, higher ratios for optimized variants).
- The diagonal line’s placement varies: In some plots (e.g., DeepSeek-R1 vs Gemini-2.5-flash-preview), the line tilts toward the y-axis model, indicating stronger performance at higher progress ratios.
- White regions often cluster around the diagonal, suggesting overlapping performance or data sparsity.
2. **Anomalies**:
- In the Llama-4-Maverick comparisons, the white regions are more extensive, possibly indicating less data or higher variability in performance.
- The Gemini-2.5-flash-preview consistently outperforms Gemini-2.0-flash at higher progress ratios, with minimal overlap.
### Interpretation
The heatmaps reveal that model performance is highly dependent on the progress ratio. Optimized variants (e.g., Gemini-2.5-flash-preview, Llama-4-Maverick-Instruct-FP8) dominate at higher progress ratios, while base models (e.g., Gemini-2.0-flash, Llama-4-Maverick) perform better at lower ratios. The diagonal line’s orientation and the distribution of yellow/dark purple regions quantify these trade-offs. The white areas highlight either parity or insufficient data, suggesting further investigation may be needed in those regions. These visualizations emphasize the importance of model selection based on the specific progress ratio requirements of a task.