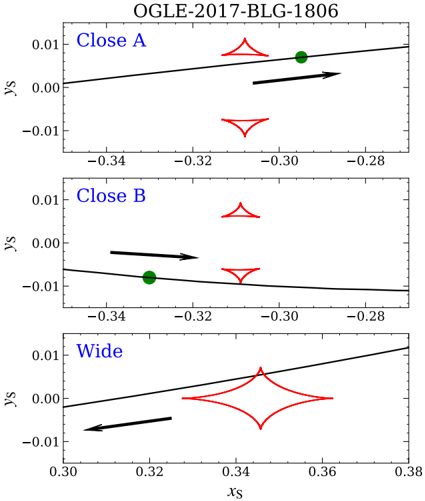
## Chart/Diagram Type: Parameter Space Diagrams
### Overview
The image presents three parameter space diagrams, each depicting a different scenario labeled "Close A", "Close B", and "Wide". Each diagram shows a black line, a red shape, a green dot, and a black arrow. The diagrams illustrate the relationship between two parameters, xs and ys, under different conditions.
### Components/Axes
* **Title:** OGLE-2017-BLG-1806
* **Y-axis (ys):** Ranges from approximately -0.01 to 0.01 in each subplot.
* **X-axis (xs):**
* Top subplot (Close A): Ranges from approximately -0.34 to -0.28.
* Middle subplot (Close B): Ranges from approximately -0.34 to -0.28.
* Bottom subplot (Wide): Ranges from approximately 0.30 to 0.38.
* **Labels:**
* Top subplot: "Close A" (blue)
* Middle subplot: "Close B" (blue)
* Bottom subplot: "Wide" (blue)
* **Elements:**
* Black line: Represents a trajectory or a curve in the parameter space.
* Red shape: Represents a region or a constraint in the parameter space. The shape varies between the subplots.
* Green dot: Represents a specific point in the parameter space.
* Black arrow: Indicates a direction or a movement in the parameter space.
### Detailed Analysis or Content Details
**Top Subplot: Close A**
* **Black Line:** The black line is nearly linear, with a slight curve. It starts at approximately (-0.34, -0.005) and ends at approximately (-0.28, 0.005).
* **Red Shape:** There are two red shapes. The top one is centered around (-0.31, 0.005), and the bottom one is centered around (-0.31, -0.01).
* **Green Dot:** The green dot is located at approximately (-0.295, 0.003).
* **Black Arrow:** The black arrow starts near the black line at approximately (-0.31, 0.002) and points towards the right.
**Middle Subplot: Close B**
* **Black Line:** The black line is curved. It starts at approximately (-0.34, -0.008) and ends at approximately (-0.28, -0.002).
* **Red Shape:** There is one red shape centered around (-0.31, 0.007).
* **Green Dot:** The green dot is located at approximately (-0.335, -0.008).
* **Black Arrow:** The black arrow starts near the green dot at approximately (-0.335, -0.007) and points towards the right.
**Bottom Subplot: Wide**
* **Black Line:** The black line is nearly linear, with a slight curve. It starts at approximately (0.30, -0.008) and ends at approximately (0.38, 0.008).
* **Red Shape:** There is one red shape centered around (0.34, 0.00). This shape is more complex than the other two, resembling a four-pointed star.
* **Green Dot:** There is no green dot in this subplot.
* **Black Arrow:** The black arrow starts near the black line at approximately (0.31, -0.007) and points towards the right.
### Key Observations
* The "Close A" and "Close B" subplots have similar x-axis ranges, while the "Wide" subplot has a different x-axis range.
* The red shapes vary significantly between the three subplots, suggesting different constraints or regions of interest in the parameter space.
* The green dot is present only in the "Close A" and "Close B" subplots.
* The black arrows indicate a direction or movement in the parameter space, but their starting points and lengths vary.
### Interpretation
The diagrams likely represent different scenarios or configurations in a parameter space related to the OGLE-2017-BLG-1806 event. The "Close A", "Close B", and "Wide" labels likely refer to different parameter regimes or observational setups. The black lines could represent the trajectory of an object or a system in the parameter space, while the red shapes could represent regions of interest or constraints on the parameters. The green dots could represent specific data points or measurements. The arrows indicate the direction of movement or evolution in the parameter space. The differences in the red shapes, green dots, and arrow placements between the subplots suggest that the underlying physical processes or observational conditions are different in each scenario.