## Line Graphs: OGLE-2017-BLG-1806 Observational Data
### Overview
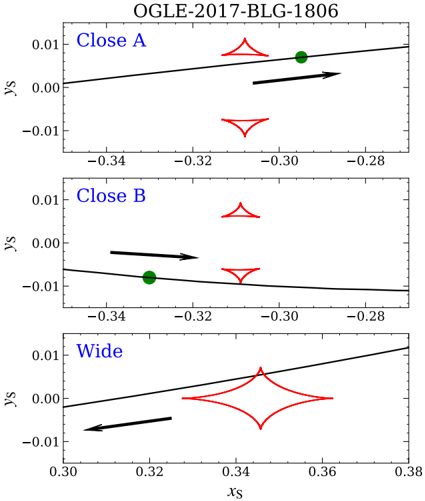
The image contains three line graphs labeled "Close A," "Close B," and "Wide," depicting positional data (xₛ, yₛ) with trend lines, confidence intervals (red shapes), and a highlighted data point (green dot). Arrows indicate directional trends or focus areas.
### Components/Axes
- **Title**: "OGLE-2017-BLG-1806" (top of all graphs).
- **Axes**:
- **xₛ**: Horizontal axis, ranging from -0.34 to 0.38 (Close A/B) and 0.30 to 0.38 (Wide).
- **yₛ**: Vertical axis, ranging from -0.01 to 0.01.
- **Legend**:
- **Red shapes**: Confidence intervals or error bounds (triangles in Close A/B, diamond in Wide).
- **Green dot**: Key data point (position varies by graph).
- **Black line**: Trend line (slope varies by graph).
- **Black arrows**: Directional indicators (Close A/B only).
### Detailed Analysis
1. **Close A**:
- Green dot at approximately (-0.32, 0.005).
- Red triangles centered near (-0.32, 0.005) with vertical spread of ±0.005.
- Black line slopes upward (slope ≈ +0.01 per unit xₛ).
- Arrow points toward the green dot from the left.
2. **Close B**:
- Green dot at approximately (-0.33, -0.005).
- Red triangles centered near (-0.33, -0.005) with vertical spread of ±0.005.
- Black line slopes downward (slope ≈ -0.01 per unit xₛ).
- Arrow points toward the green dot from the right.
3. **Wide**:
- Red diamond centered at approximately (0.34, 0.005) with horizontal spread of ±0.01 and vertical spread of ±0.005.
- Black line slopes upward (slope ≈ +0.02 per unit xₛ).
- Arrow points toward the diamond from the left.
### Key Observations
- **Close A/B**: Green dots align with trend lines but deviate slightly (Close A: +0.005 above trend; Close B: -0.005 below trend).
- **Wide**: Red diamond overlaps the trend line but extends horizontally beyond it.
- **Arrows**: Direct attention to the green dot in Close A/B and the diamond in Wide.
- **Confidence Intervals**: Red shapes indicate measurement uncertainty, smallest in Close A/B and largest in Wide.
### Interpretation
The graphs likely represent positional measurements (e.g., celestial object tracking) with varying spatial resolutions ("Close" vs. "Wide"). The green dot in Close A/B may denote a critical observation point, while the red shapes quantify uncertainty. The upward trend in Close A and Wide suggests a positive correlation between xₛ and yₛ, whereas Close B’s downward trend indicates an inverse relationship. The arrows imply a directional focus or predicted movement. The Wide graph’s broader confidence interval (diamond) suggests lower precision at larger xₛ values.
**Notable Anomalies**:
- Close B’s green dot lies below the trend line, potentially indicating an outlier or measurement deviation.
- Wide’s diamond spans the trend line, suggesting ambiguity in the relationship at larger xₛ.