## Line Chart: Accuracy vs. Training Steps for Various LLM Configurations
### Overview
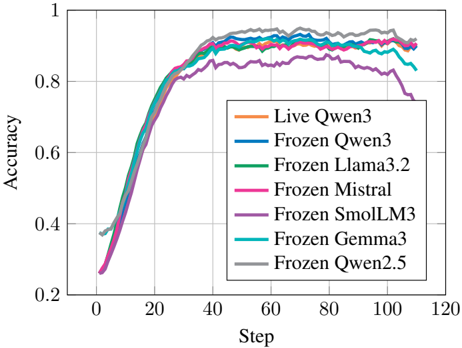
This chart illustrates the performance trajectory of seven different Large Language Model (LLM) configurations over a series of training or evaluation steps. The Y-axis represents "Accuracy" (ranging from 0.2 to 1.0), and the X-axis represents "Step" (ranging from 0 to 120). The chart tracks how quickly each model converges to its peak accuracy and how stable that accuracy remains over time.
### Components/Axes
* **X-Axis:** Labeled "Step". The scale is linear, with major grid lines at intervals of 20 (0, 20, 40, 60, 80, 100, 120).
* **Y-Axis:** Labeled "Accuracy". The scale is linear, with major grid lines at intervals of 0.2 (0.2, 0.4, 0.6, 0.8, 1.0).
* **Legend:** Located in the center-right quadrant of the chart area. It maps the following colors to specific model configurations:
* **Orange:** Live Qwen3
* **Blue:** Frozen Qwen3
* **Green:** Frozen Llama3.2
* **Pink:** Frozen Mistral
* **Purple:** Frozen SmolLM3
* **Teal:** Frozen Gemma3
* **Grey:** Frozen Qwen2.5
### Detailed Analysis
The chart can be segmented into three distinct phases based on the visual trends of the data series:
**1. Initial Learning Phase (Steps 0–30):**
* **Trend:** All models exhibit a steep, positive slope, indicating rapid learning.
* **Values:**
* "Frozen Qwen2.5" (Grey) and "Live Qwen3" (Orange) start at a higher baseline (approx. 0.35–0.40) compared to the others.
* The remaining models (Blue, Green, Pink, Purple, Teal) start at a lower baseline (approx. 0.25).
* By Step 20, all models converge to an accuracy range of approximately 0.65–0.70.
**2. Plateau/Stability Phase (Steps 30–90):**
* **Trend:** The rate of improvement slows significantly, and the lines flatten out, indicating the models have reached a saturation point.
* **Values:**
* **Top Performers:** "Frozen Qwen2.5" (Grey) consistently maintains the highest accuracy, hovering between 0.90 and 0.95.
* **Mid-Tier:** "Live Qwen3" (Orange), "Frozen Qwen3" (Blue), "Frozen Llama3.2" (Green), and "Frozen Mistral" (Pink) cluster tightly together, maintaining accuracy between 0.88 and 0.92.
* **Lower-Tier:** "Frozen SmolLM3" (Purple) plateaus at a lower accuracy, approximately 0.85.
* **Volatile:** "Frozen Gemma3" (Teal) plateaus around 0.90 but exhibits more frequent fluctuations compared to the other models.
**3. Late-Stage Divergence (Steps 90–110+):**
* **Trend:** While most models remain stable, two specific models show a distinct downward trend.
* **Values:**
* "Frozen SmolLM3" (Purple) experiences a sharp decline, dropping from ~0.85 to ~0.75.
* "Frozen Gemma3" (Teal) experiences a decline, dropping from ~0.90 to ~0.83.
* The remaining models (Grey, Orange, Blue, Green, Pink) maintain their accuracy levels above 0.90.
### Key Observations
* **Performance Stability:** "Frozen Qwen2.5" (Grey) is the most robust model, showing the highest accuracy and the least amount of degradation toward the end of the steps.
* **The "Cliff" Effect:** There is a notable performance degradation for "Frozen SmolLM3" and "Frozen Gemma3" after Step 90. This suggests these specific models may be prone to overfitting or instability when trained beyond a certain point in this specific task.
* **Frozen vs. Live:** The "Live Qwen3" (Orange) performs nearly identically to the "Frozen Qwen3" (Blue), suggesting that for this specific task, freezing the model weights does not negatively impact the model's ability to achieve high accuracy.
### Interpretation
The data demonstrates that for the task being measured, most of the tested LLMs reach peak performance relatively quickly (by Step 40). The primary differentiator is not the initial learning speed, but rather the long-term stability of the accuracy.
The divergence observed after Step 90 is critical. The decline in accuracy for "Frozen SmolLM3" and "Frozen Gemma3" suggests that these models may be experiencing "catastrophic forgetting" or training instability if the training process is extended too long. Conversely, the Qwen-based models (Live and Frozen) and the Llama/Mistral variants demonstrate superior robustness, maintaining their performance levels throughout the entire duration. This chart serves as a strong indicator for selecting a model configuration that balances high peak accuracy with long-term training stability.