\n
## Line Chart: Accuracy vs. Step for Various Models
### Overview
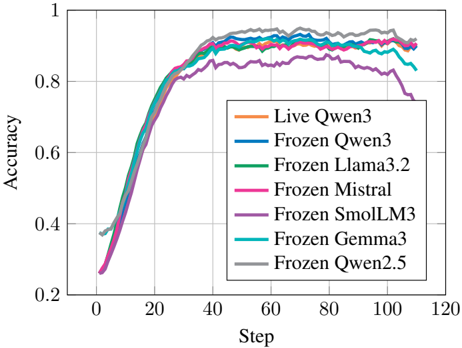
This image presents a line chart illustrating the accuracy of several language models (Live Qwen3 and various Frozen models) over a series of steps, likely representing training iterations. The chart aims to compare the learning curves of these models.
### Components/Axes
* **X-axis:** "Step" - Ranging from approximately 0 to 120.
* **Y-axis:** "Accuracy" - Ranging from approximately 0.2 to 1.0.
* **Legend:** Located in the top-right corner, listing the following models with corresponding colors:
* Live Qwen3 (Orange)
* Frozen Qwen3 (Blue)
* Frozen Llama3.2 (Green)
* Frozen Mistral (Magenta/Pink)
* Frozen SmolLM3 (Purple)
* Frozen Gemma3 (Cyan/Light Blue)
* Frozen Qwen2.5 (Gray)
* **Gridlines:** Present to aid in reading values.
### Detailed Analysis
The chart displays seven distinct lines, each representing the accuracy of a different model as the "Step" increases.
* **Live Qwen3 (Orange):** Starts at approximately 0.38 at Step 0, rapidly increases to around 0.85 by Step 20, plateaus around 0.92-0.94 between Steps 40 and 100, and then slightly decreases to approximately 0.91 at Step 120.
* **Frozen Qwen3 (Blue):** Begins at approximately 0.38 at Step 0, increases quickly to around 0.84 by Step 20, reaches a plateau around 0.92-0.93 between Steps 40 and 100, and then slightly declines to approximately 0.91 at Step 120.
* **Frozen Llama3.2 (Green):** Starts at approximately 0.38 at Step 0, rises to around 0.83 by Step 20, plateaus around 0.90-0.92 between Steps 40 and 100, and then decreases to approximately 0.89 at Step 120.
* **Frozen Mistral (Magenta/Pink):** Begins at approximately 0.35 at Step 0, increases to around 0.82 by Step 20, reaches a plateau around 0.89-0.91 between Steps 40 and 100, and then decreases to approximately 0.87 at Step 120.
* **Frozen SmolLM3 (Purple):** Starts at approximately 0.38 at Step 0, increases to around 0.83 by Step 20, plateaus around 0.90-0.92 between Steps 40 and 100, and then decreases to approximately 0.88 at Step 120.
* **Frozen Gemma3 (Cyan/Light Blue):** Begins at approximately 0.38 at Step 0, increases to around 0.84 by Step 20, plateaus around 0.92-0.93 between Steps 40 and 100, and then slightly declines to approximately 0.91 at Step 120.
* **Frozen Qwen2.5 (Gray):** Starts at approximately 0.38 at Step 0, increases to around 0.83 by Step 20, plateaus around 0.90-0.92 between Steps 40 and 100, and then decreases to approximately 0.88 at Step 120.
All lines exhibit a similar initial steep increase in accuracy, followed by a plateauing phase.
### Key Observations
* **Similar Performance:** The "Live Qwen3" and "Frozen Qwen3" models show nearly identical performance curves.
* **Plateau:** All models reach a plateau in accuracy after approximately 20-40 steps.
* **Slight Decline:** Most models experience a slight decrease in accuracy after Step 100.
* **Frozen Llama3.2 and Frozen Mistral** consistently show the lowest accuracy among the models.
### Interpretation
The data suggests that all the models demonstrate effective learning up to a certain point (around 40 steps), after which further training yields diminishing returns. The close proximity of the "Live Qwen3" and "Frozen Qwen3" curves indicates that freezing the weights doesn't significantly impact performance in this scenario. The slight decline in accuracy after Step 100 could be due to overfitting or the model reaching its capacity. The differences in peak accuracy between the models suggest varying levels of inherent capability or sensitivity to the training process. The fact that all models converge to a similar accuracy range suggests a common underlying learning dynamic. The models "Frozen Llama3.2" and "Frozen Mistral" may require different training parameters or architectures to achieve comparable performance to the other models.