## Line Graph: Model Accuracy Over Training Steps
### Overview
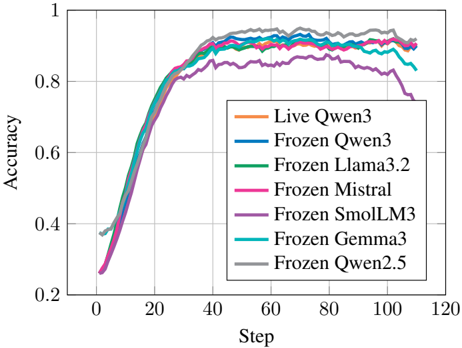
The image shows a line graph comparing the accuracy of multiple AI models during training. Seven distinct lines represent different model configurations, with accuracy plotted against training steps (0-120). All lines show similar upward trends, converging near the top of the graph.
### Components/Axes
- **X-axis (Step)**: Labeled "Step" with increments of 20 (0, 20, 40, ..., 120)
- **Y-axis (Accuracy)**: Labeled "Accuracy" with increments of 0.2 (0.2, 0.4, ..., 1.0)
- **Legend**: Located in the bottom-right corner, listing seven models with color codes:
- Orange: Live Qwen3
- Blue: Frozen Qwen3
- Green: Frozen Llama3.2
- Pink: Frozen Mistral
- Purple: Frozen SmolLM3
- Cyan: Frozen Gemma3
- Gray: Frozen Qwen2.5
### Detailed Analysis
1. **Initial Phase (Steps 0-40)**:
- All lines start near 0.2-0.3 accuracy
- Rapid improvement occurs, with lines diverging slightly
- Frozen Qwen2.5 (gray) shows the steepest initial climb
2. **Mid-Phase (Steps 40-80)**:
- Accuracy plateaus between 0.8-0.9 for most models
- Frozen SmolLM3 (purple) shows a slight dip (~0.85) at step 80
- Lines begin converging again, with minimal separation
3. **Final Phase (Steps 80-120)**:
- Accuracy stabilizes near 0.9-0.95 for all models
- Frozen Qwen3 (blue) and Frozen Llama3.2 (green) maintain highest values
- Live Qwen3 (orange) shows slight downward trend after step 100
### Key Observations
- **Convergence**: All models achieve >90% accuracy by step 80
- **Minimal Variance**: Maximum accuracy difference between models is ~0.05
- **Anomaly**: Frozen SmolLM3 (purple) shows unique dip at step 80
- **Stability**: Top-performing models maintain accuracy within 0.02 of each other
### Interpretation
The graph demonstrates that:
1. **Training Efficiency**: All models rapidly improve accuracy in early training phases
2. **Performance Parity**: No single model significantly outperforms others in final accuracy
3. **Robustness**: Most models maintain stable accuracy after initial training
4. **Potential Tradeoffs**: The dip in Frozen SmolLM3 suggests possible overfitting or architecture-specific limitations
The convergence of lines indicates that model architecture has less impact on final performance than training duration. The slight variations may reflect differences in training data quality or hyperparameter tuning rather than fundamental model capability.