## Line Chart: Training Performance Metrics
### Overview
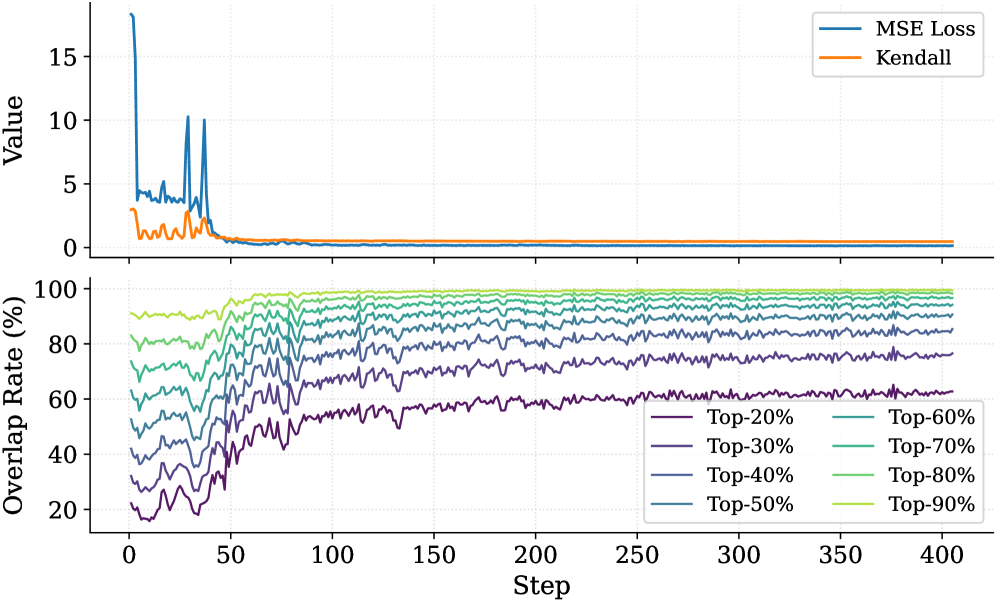
The image presents a line chart displaying training performance metrics over 400 steps. The chart consists of two subplots: the top subplot shows the MSE Loss and Kendall's Tau correlation coefficient, while the bottom subplot displays the overlap rate for different percentile groups (Top-20%, Top-30%, etc.). The x-axis represents the training step, and the y-axes represent the respective metric values.
### Components/Axes
* **X-axis (Both Subplots):** Step (ranging from 0 to 400)
* **Y-axis (Top Subplot):** Value (ranging from 0 to 16, approximately)
* **Y-axis (Bottom Subplot):** Overlap Rate (%) (ranging from 0 to 100)
* **Legend (Top Subplot):**
* Blue Line: MSE Loss
* Orange Line: Kendall
* **Legend (Bottom Subplot):** Located in the bottom-right corner.
* Dark Gray Line: Top-20%
* Purple Line: Top-30%
* Dark Blue Line: Top-40%
* Teal Line: Top-50%
* Green Line: Top-60%
* Yellow Line: Top-70%
* Light Blue Line: Top-80%
* Gray Line: Top-90%
### Detailed Analysis or Content Details
**Top Subplot (MSE Loss & Kendall's Tau):**
* **MSE Loss (Blue Line):** Starts at approximately 16, rapidly decreases to around 2 by step 10, then fluctuates between 1 and 2, stabilizing around 1.5 after step 100.
* **Kendall (Orange Line):** Starts at approximately 2, decreases to around 0.5 by step 10, and then stabilizes around 0.2-0.3 after step 50.
**Bottom Subplot (Overlap Rate):**
* **Top-20% (Dark Gray):** Starts at approximately 18%, increases to around 65% by step 100, and then fluctuates between 60% and 70% for the remainder of the training.
* **Top-30% (Purple):** Starts at approximately 20%, increases to around 68% by step 100, and then fluctuates between 62% and 72%.
* **Top-40% (Dark Blue):** Starts at approximately 22%, increases to around 70% by step 100, and then fluctuates between 64% and 74%.
* **Top-50% (Teal):** Starts at approximately 24%, increases to around 72% by step 100, and then fluctuates between 66% and 76%.
* **Top-60% (Green):** Starts at approximately 26%, increases to around 74% by step 100, and then fluctuates between 68% and 78%.
* **Top-70% (Yellow):** Starts at approximately 28%, increases to around 76% by step 100, and then fluctuates between 70% and 80%.
* **Top-80% (Light Blue):** Starts at approximately 30%, increases to around 78% by step 100, and then fluctuates between 72% and 82%.
* **Top-90% (Gray):** Starts at approximately 32%, increases to around 80% by step 100, and then fluctuates between 74% and 84%.
All overlap rate lines exhibit a similar upward trend initially, converging to a relatively stable range after step 100. The higher percentile groups (Top-90%) consistently show higher overlap rates than the lower percentile groups (Top-20%).
### Key Observations
* The MSE Loss decreases rapidly initially and then plateaus, indicating the model is learning.
* Kendall's Tau also decreases and stabilizes, suggesting a diminishing correlation as training progresses.
* The overlap rates for all percentile groups increase with training steps, indicating improved performance across different levels of confidence.
* The overlap rates are positively correlated with the percentile group, meaning higher percentiles have higher overlap rates.
* The overlap rates stabilize after approximately 100 steps, suggesting the model's performance has converged.
### Interpretation
The data suggests that the model is learning effectively, as evidenced by the decreasing MSE Loss and increasing overlap rates. The stabilization of these metrics after 100 steps indicates that the model has likely converged. The consistent positive correlation between percentile group and overlap rate suggests that the model is more confident in its predictions for higher-ranked items. The decreasing Kendall's Tau suggests that the model's ability to perfectly rank items diminishes as training progresses, which is expected as the model focuses on minimizing loss rather than maintaining perfect ranking. The combination of these metrics provides a comprehensive view of the model's training progress and performance. The initial spike in MSE Loss could be attributed to the model adjusting its weights at the beginning of training.