## Diagram: Causal Analysis for Auditing Algorithmic Fairness
### Overview
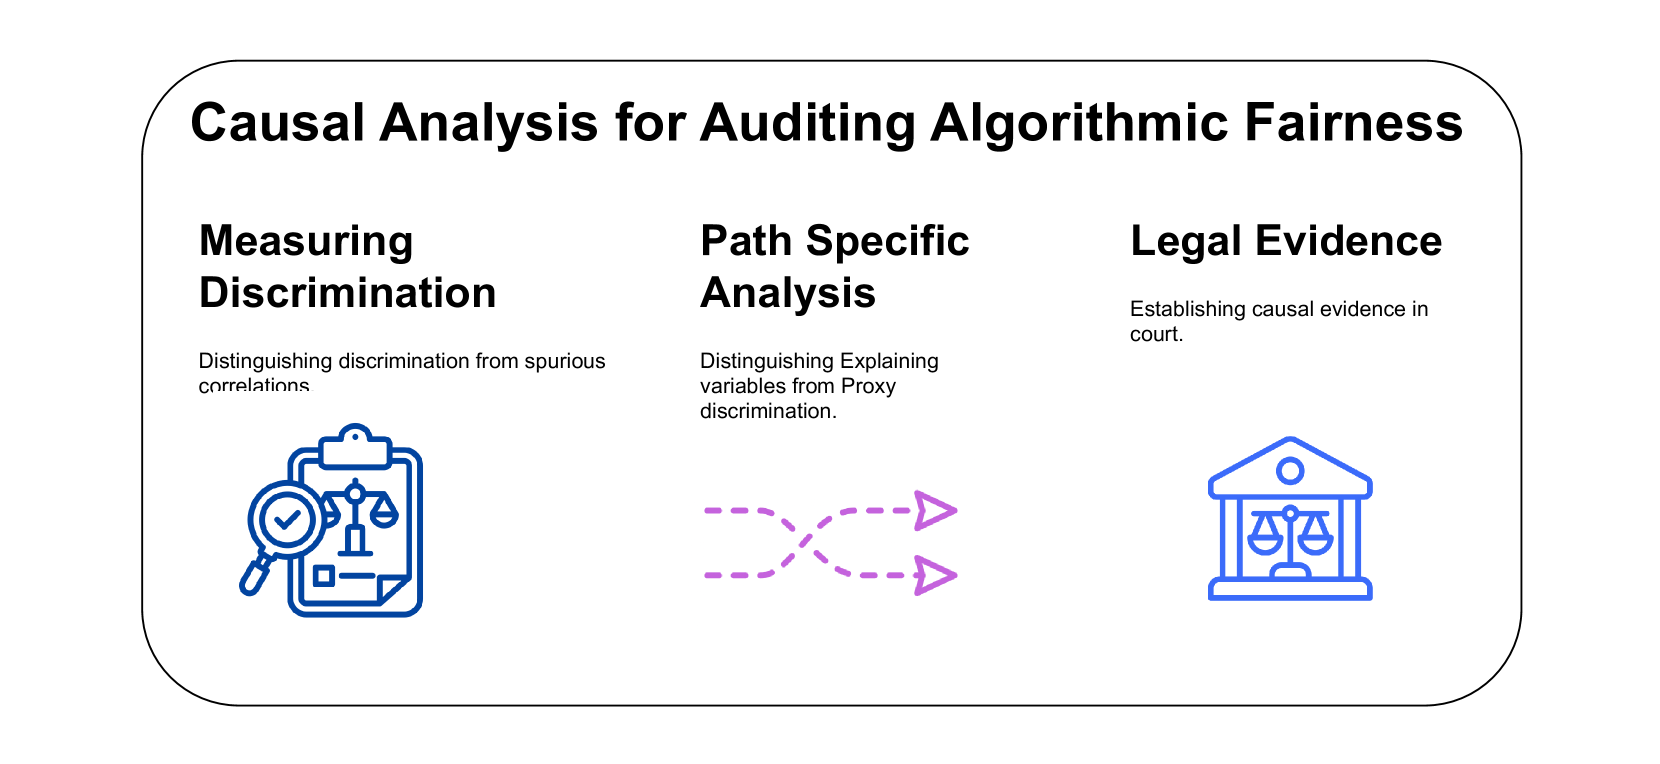
The image is a diagram outlining three key components of causal analysis for auditing algorithmic fairness: Measuring Discrimination, Path Specific Analysis, and Legal Evidence. Each component is represented with a title, a brief description, and a corresponding icon.
### Components/Axes
* **Title:** Causal Analysis for Auditing Algorithmic Fairness
* **Component 1:**
* Title: Measuring Discrimination
* Description: Distinguishing discrimination from spurious correlations
* Icon: A blue clipboard with a magnifying glass over a scale.
* **Component 2:**
* Title: Path Specific Analysis
* Description: Distinguishing Explaining variables from Proxy discrimination.
* Icon: Two dashed purple lines crossing each other, each ending with an arrow.
* **Component 3:**
* Title: Legal Evidence
* Description: Establishing causal evidence in court.
* Icon: A blue building resembling a courthouse with a scale inside.
### Detailed Analysis
* **Measuring Discrimination:** This component focuses on differentiating genuine discriminatory practices from coincidental correlations that may appear discriminatory but are not causally linked. The icon of a clipboard, magnifying glass, and scale suggests a process of investigation and evaluation.
* **Path Specific Analysis:** This component deals with identifying and understanding the specific pathways through which discrimination occurs. It aims to distinguish explanatory variables from proxy variables, which might mask the true causes of discrimination. The icon of crossing dashed lines with arrows indicates the analysis of different causal paths.
* **Legal Evidence:** This component involves establishing causal evidence that can be used in legal proceedings. It focuses on providing concrete proof of discrimination based on causal relationships. The icon of a courthouse with a scale symbolizes the legal context and the need for balanced judgment.
### Key Observations
* The diagram presents a structured approach to auditing algorithmic fairness, emphasizing the importance of causal analysis.
* Each component is clearly defined with a specific focus and purpose.
* The icons provide visual cues that reinforce the meaning of each component.
### Interpretation
The diagram illustrates a multi-faceted approach to addressing algorithmic fairness. It highlights the need to go beyond simple correlation analysis and delve into the underlying causal mechanisms that drive discriminatory outcomes. By focusing on measuring discrimination, analyzing specific causal paths, and establishing legal evidence, the diagram suggests a comprehensive strategy for identifying and mitigating algorithmic bias. The components are related in that they represent different stages or aspects of a thorough investigation into algorithmic fairness, ultimately aiming to provide a robust and legally defensible assessment.