\n
## Diagram: Causal Analysis for Auditing Algorithmic Fairness
### Overview
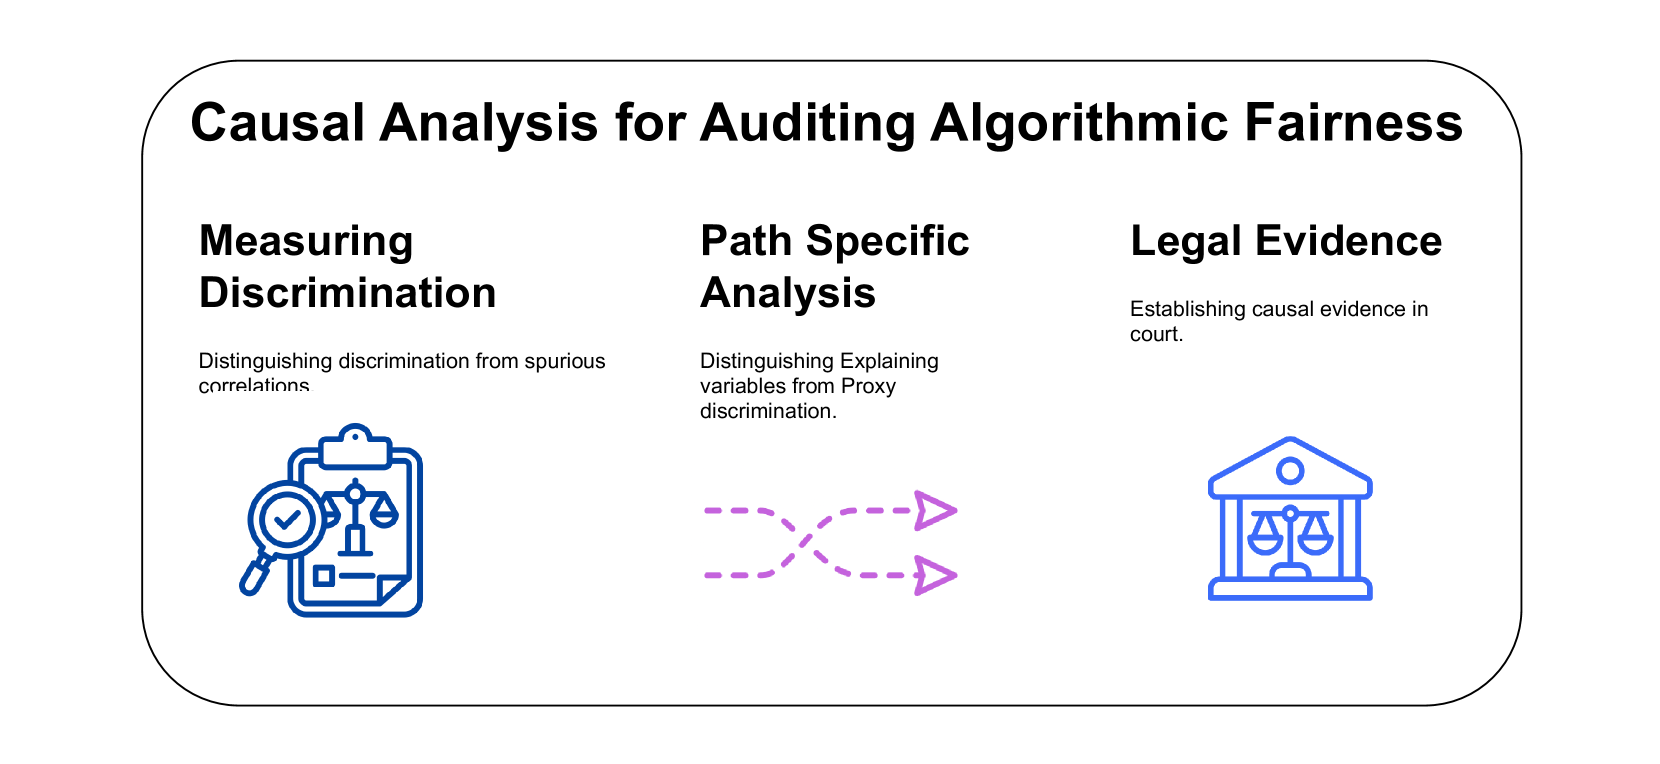
The image is a diagram illustrating three key areas within causal analysis for auditing algorithmic fairness: Measuring Discrimination, Path Specific Analysis, and Legal Evidence. Each area is represented by a title, a brief description, and a corresponding icon. The diagram is presented on a light gray background with a darker gray header.
### Components/Axes
The diagram consists of three main sections arranged horizontally.
* **Header:** "Causal Analysis for Auditing Algorithmic Fairness" - positioned at the top-center.
* **Section 1 (Left):** "Measuring Discrimination" with the subtext "Distinguishing discrimination from spurious correlations." Accompanied by an icon of a clipboard with a magnifying glass.
* **Section 2 (Center):** "Path Specific Analysis" with the subtext "Distinguishing Explaining variables from Proxy discrimination." Accompanied by an icon depicting a series of connected arrows.
* **Section 3 (Right):** "Legal Evidence" with the subtext "Establishing causal evidence in court." Accompanied by an icon of a courthouse building.
### Detailed Analysis or Content Details
The diagram does not contain numerical data or axes. It is a conceptual illustration. The icons are symbolic representations of the concepts.
* **Measuring Discrimination:** The clipboard icon suggests data collection and investigation. The magnifying glass implies a detailed examination.
* **Path Specific Analysis:** The arrows indicate a flow or relationship between variables. The dashed lines suggest potential pathways, and the solid arrows indicate confirmed or established relationships.
* **Legal Evidence:** The courthouse icon represents the application of these analyses in a legal context.
### Key Observations
The diagram presents a logical progression from identifying and measuring discrimination to understanding the underlying causal paths and ultimately using this information as legal evidence. The visual layout emphasizes the interconnectedness of these three areas.
### Interpretation
This diagram outlines a framework for auditing algorithmic fairness using causal analysis. It suggests that simply identifying discriminatory outcomes is insufficient; it's crucial to understand *why* those outcomes occur. The "Path Specific Analysis" section highlights the importance of distinguishing between variables that genuinely explain the outcome and those that are merely correlated with it (proxy discrimination). Finally, the diagram emphasizes the practical application of this analysis in legal settings, where establishing causality is essential for demonstrating unfairness. The diagram is a high-level overview and does not provide specific methodologies or techniques for conducting these analyses. It serves as a conceptual roadmap for a more detailed investigation into algorithmic fairness.