## Diagram: Causal Analysis for Auditing Algorithmic Fairness
### Overview
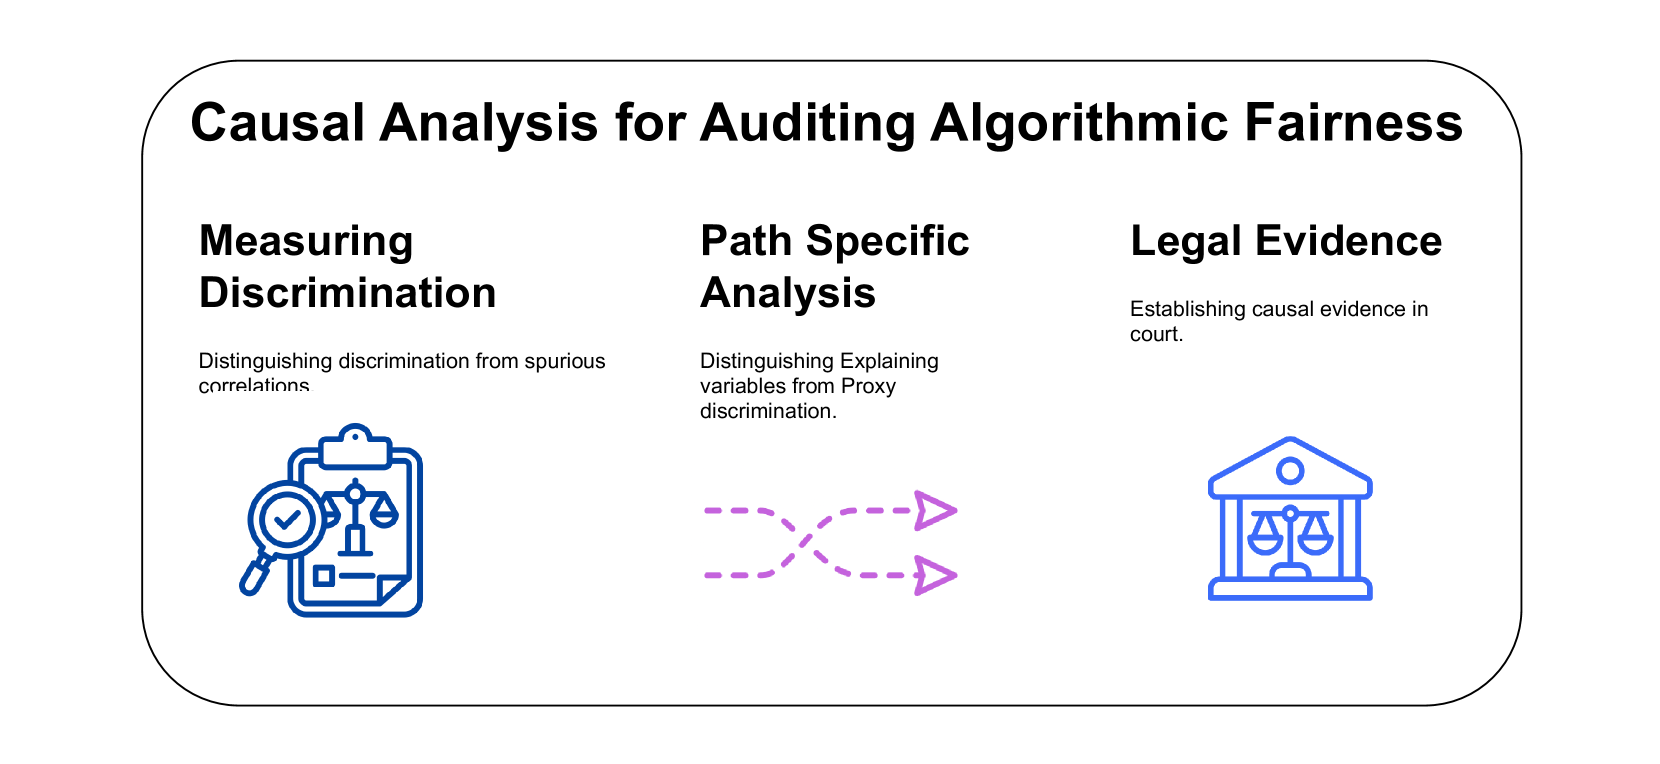
The diagram outlines a three-part framework for auditing algorithmic fairness through causal analysis. It emphasizes distinguishing discrimination from spurious correlations, analyzing variables and proxies, and establishing legal evidence standards.
### Components/Axes
1. **Sections**:
- **Measuring Discrimination** (left): Focuses on distinguishing discrimination from spurious correlations.
- **Path Specific Analysis** (center): Examines variables and proxies to identify discrimination.
- **Legal Evidence** (right): Establishes causal evidence standards for court proceedings.
2. **Icons**:
- **Left**: A clipboard with a magnifying glass and scales of justice (symbolizing scrutiny and fairness).
- **Center**: Purple dashed arrows forming a bidirectional loop (representing variable-proxy relationships).
- **Right**: A courthouse with scales of justice (symbolizing legal frameworks).
3. **Textual Labels**:
- Headings: "Measuring Discrimination," "Path Specific Analysis," "Legal Evidence."
- Subheadings:
- "Distinguishing discrimination from spurious correlations"
- "Distinguishing Explaining variables from Proxy discrimination"
- "Establishing causal evidence in court"
### Detailed Analysis
- **Measuring Discrimination**:
- Text emphasizes isolating discrimination from coincidental patterns (spurious correlations).
- Icon reinforces the need for rigorous scrutiny (magnifying glass) and fairness (scales).
- **Path Specific Analysis**:
- Purple dashed arrows suggest a non-linear, bidirectional relationship between variables and proxy discrimination.
- Highlights the complexity of tracing causal pathways in algorithms.
- **Legal Evidence**:
- Focuses on translating technical findings into court-admissible causal evidence.
- Icon of a courthouse underscores the need for legal accountability.
### Key Observations
- No numerical data or quantitative trends are present; the diagram is conceptual.
- The bidirectional arrows in the center section imply feedback loops between variables and proxies.
- All icons use blue outlines, with the center section uniquely using purple for emphasis.
### Interpretation
This framework bridges technical auditing and legal accountability:
1. **Technical Rigor**: The left and center sections stress methodological precision in identifying discrimination.
2. **Legal Translation**: The right section ensures findings meet judicial standards, addressing gaps in current AI governance.
3. **Visual Symbolism**:
- The scales of justice in both the left and right icons reinforce fairness as a recurring theme.
- The purple arrows in the center section visually differentiate the analytical complexity from the other sections.
The diagram advocates for a holistic approach to algorithmic fairness, combining statistical analysis with legal frameworks to ensure accountability.