# Technical Document Extraction
## Image Description
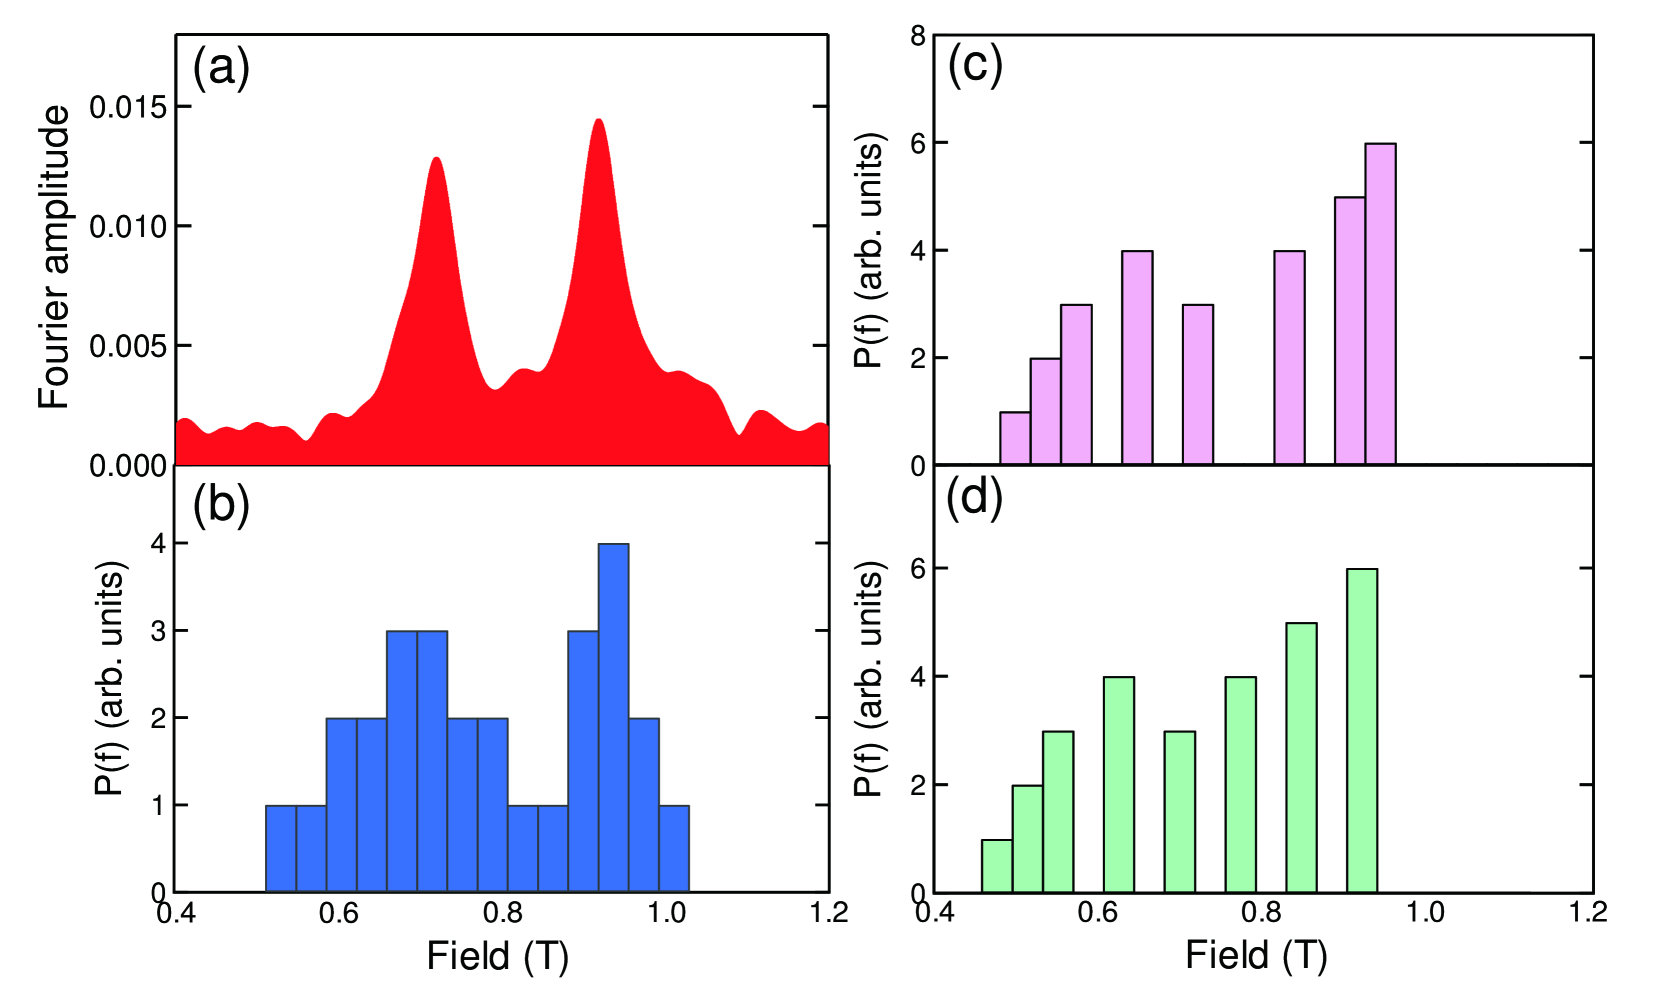
The image contains four distinct panels labeled (a), (b), (c), and (d), arranged in a 2x2 grid. Each panel represents a different data visualization type, with shared axis labels and color-coded data series. The legend is located in the top-right corner of the image.
---
### Panel (a): Fourier Amplitude vs. Field (T)
- **Type**: Line plot
- **Color**: Red
- **X-axis**: Field (T) ranging from 0.4 to 1.2 T
- **Y-axis**: Fourier amplitude (0.000 to 0.015)
- **Key Features**:
- Two prominent peaks at approximately **0.7 T** and **0.9 T**
- Baseline Fourier amplitude remains near 0.000 for most of the field range
- Secondary smaller peaks observed near **0.5 T** and **1.1 T**
---
### Panel (b): Histogram of Field (T)
- **Type**: Bar histogram
- **Color**: Blue
- **X-axis**: Field (T) ranging from 0.4 to 1.2 T
- **Y-axis**: Probability density (P(f)) in arbitrary units (0 to 4)
- **Key Features**:
- Tallest bar centered at **0.8 T** with a height of ~3.5 units
- Secondary peaks at **0.6 T** (~2.5 units) and **1.0 T** (~2.0 units)
- Uniform bin width across the field range
---
### Panel (c): Histogram of P(f) vs. Field (T)
- **Type**: Bar histogram
- **Color**: Purple
- **X-axis**: Field (T) ranging from 0.4 to 1.2 T
- **Y-axis**: Probability density (P(f)) in arbitrary units (0 to 8)
- **Key Features**:
- Tallest bar at **0.9 T** with a height of ~6 units
- Secondary peaks at **0.7 T** (~4 units) and **1.1 T** (~5 units)
- Asymmetric distribution with increasing P(f) toward higher fields
---
### Panel (d): Histogram of P(f) vs. Field (T)
- **Type**: Bar histogram
- **Color**: Green
- **X-axis**: Field (T) ranging from 0.4 to 1.2 T
- **Y-axis**: Probability density (P(f)) in arbitrary units (0 to 8)
- **Key Features**:
- Tallest bar at **1.0 T** with a height of ~6 units
- Secondary peaks at **0.8 T** (~4.5 units) and **0.6 T** (~3 units)
- Gradual increase in P(f) with field strength
---
### Legend
- **Location**: Top-right corner of the image
- **Color-Coding**:
- Red: Panel (a) - Fourier amplitude
- Blue: Panel (b) - Field histogram
- Purple: Panel (c) - P(f) histogram
- Green: Panel (d) - P(f) histogram
---
### Spatial Grounding
- **Legend Position**: [x=0.85, y=0.95] (normalized coordinates)
- **Data Point Verification**:
- Panel (a) red line matches legend
- Panel (b) blue bars match legend
- Panel (c) purple bars match legend
- Panel (d) green bars match legend
---
### Trend Verification
1. **Panel (a)**: Red line slopes upward to two peaks at 0.7T and 0.9T, then declines.
2. **Panel (b)**: Blue histogram peaks at 0.8T, with smaller peaks at 0.6T and 1.0T.
3. **Panel (c)**: Purple histogram shows increasing P(f) toward 0.9T, with a secondary peak at 1.1T.
4. **Panel (d)**: Green histogram peaks at 1.0T, with secondary peaks at 0.8T and 0.6T.
---
### Notes
- No textual data beyond axis labels and units is present in the image.
- All axis labels and units are explicitly stated in the image.
- No data tables or embedded text blocks are visible.