TECHNICAL ASSET FINGERPRINT
6872e0fc32baf49abecd26c1
Click to view fullscreen
Press ESC or click to close
FOUND IN PAPERS
EXPERT: gemini-2.0-flash VERSION 1
RUNTIME: nugit/gemini/gemini-2.0-flash
INTEL_VERIFIED
## Line Charts: Model Performance on Math Problems
### Overview
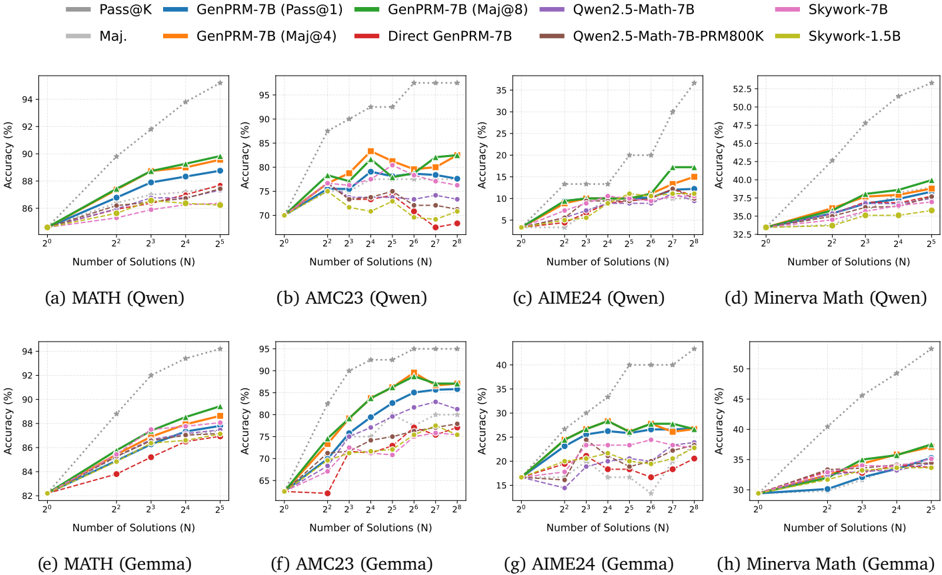
The image contains eight line charts comparing the performance of different language models on various math problem datasets. The charts are arranged in a 2x4 grid, with the top row showing results for models using "Qwen" and the bottom row using "Gemma." Each chart plots the accuracy of the models against the number of solutions used. The models compared include Pass@K, GenPRM-7B with different configurations (Pass@1, Maj@4, Maj@8, Direct), Qwen2.5-Math-7B, Qwen2.5-Math-7B-PRM800K, Skywork-7B, and Skywork-1.5B.
### Components/Axes
* **X-axis (Horizontal):** Number of Solutions (N). The x-axis is logarithmic, with values ranging from 2<sup>0</sup> to 2<sup>5</sup> in most charts, and up to 2<sup>8</sup> in the AMC23 charts.
* **Y-axis (Vertical):** Accuracy (%). The y-axis scale varies depending on the chart, ranging from approximately 85% to 95% for MATH, 65% to 95% for AMC23, 5% to 35% for AIME24, and 32.5% to 52.5% for Minerva Math.
* **Chart Titles:** Each chart has a title indicating the dataset and the model family used:
* (a) MATH (Qwen)
* (b) AMC23 (Qwen)
* (c) AIME24 (Qwen)
* (d) Minerva Math (Qwen)
* (e) MATH (Gemma)
* (f) AMC23 (Gemma)
* (g) AIME24 (Gemma)
* (h) Minerva Math (Gemma)
* **Legend (Top):** The legend is located at the top of the image and identifies each model by color and name:
* **Gray dotted line:** Pass@K
* **Blue line:** GenPRM-7B (Pass@1)
* **Gray line:** Maj.
* **Orange line:** GenPRM-7B (Maj@4)
* **Green line:** GenPRM-7B (Maj@8)
* **Red line:** Direct GenPRM-7B
* **Purple line:** Qwen2.5-Math-7B
* **Brown line:** Qwen2.5-Math-7B-PRM800K
* **Pink line:** Skywork-7B
* **Yellow-Green line:** Skywork-1.5B
### Detailed Analysis
#### (a) MATH (Qwen)
* **Pass@K (Gray dotted line):** Accuracy increases sharply from approximately 82% at 2<sup>0</sup> to 94% at 2<sup>5</sup>.
* **GenPRM-7B (Pass@1) (Blue line):** Accuracy increases from approximately 84% at 2<sup>0</sup> to 89% at 2<sup>5</sup>.
* **Maj. (Gray line):** Accuracy remains relatively flat around 86%.
* **GenPRM-7B (Maj@4) (Orange line):** Accuracy increases slightly from approximately 85% to 88%.
* **GenPRM-7B (Maj@8) (Green line):** Accuracy increases slightly from approximately 85% to 90%.
* **Direct GenPRM-7B (Red line):** Accuracy remains relatively flat around 85%.
* **Qwen2.5-Math-7B (Purple line):** Accuracy remains relatively flat around 87%.
* **Qwen2.5-Math-7B-PRM800K (Brown line):** Accuracy remains relatively flat around 86%.
* **Skywork-7B (Pink line):** Accuracy remains relatively flat around 87%.
* **Skywork-1.5B (Yellow-Green line):** Accuracy remains relatively flat around 86%.
#### (b) AMC23 (Qwen)
* **Pass@K (Gray dotted line):** Accuracy increases sharply from approximately 65% at 2<sup>0</sup> to 95% at 2<sup>8</sup>.
* **GenPRM-7B (Pass@1) (Blue line):** Accuracy increases from approximately 70% at 2<sup>0</sup> to 85% at 2<sup>8</sup>.
* **Maj. (Gray line):** Accuracy fluctuates between 75% and 80%.
* **GenPRM-7B (Maj@4) (Orange line):** Accuracy fluctuates between 75% and 85%.
* **GenPRM-7B (Maj@8) (Green line):** Accuracy fluctuates between 75% and 85%.
* **Direct GenPRM-7B (Red line):** Accuracy fluctuates between 70% and 75%.
* **Qwen2.5-Math-7B (Purple line):** Accuracy fluctuates between 75% and 80%.
* **Qwen2.5-Math-7B-PRM800K (Brown line):** Accuracy fluctuates between 70% and 75%.
* **Skywork-7B (Pink line):** Accuracy fluctuates between 75% and 80%.
* **Skywork-1.5B (Yellow-Green line):** Accuracy fluctuates between 70% and 75%.
#### (c) AIME24 (Qwen)
* **Pass@K (Gray dotted line):** Accuracy increases sharply from approximately 5% at 2<sup>0</sup> to 35% at 2<sup>8</sup>.
* **GenPRM-7B (Pass@1) (Blue line):** Accuracy increases from approximately 5% at 2<sup>0</sup> to 20% at 2<sup>8</sup>.
* **Maj. (Gray line):** Accuracy fluctuates between 5% and 10%.
* **GenPRM-7B (Maj@4) (Orange line):** Accuracy fluctuates between 10% and 25%.
* **GenPRM-7B (Maj@8) (Green line):** Accuracy fluctuates between 10% and 25%.
* **Direct GenPRM-7B (Red line):** Accuracy fluctuates between 5% and 10%.
* **Qwen2.5-Math-7B (Purple line):** Accuracy fluctuates between 10% and 20%.
* **Qwen2.5-Math-7B-PRM800K (Brown line):** Accuracy fluctuates between 5% and 10%.
* **Skywork-7B (Pink line):** Accuracy fluctuates between 10% and 20%.
* **Skywork-1.5B (Yellow-Green line):** Accuracy fluctuates between 5% and 10%.
#### (d) Minerva Math (Qwen)
* **Pass@K (Gray dotted line):** Accuracy increases sharply from approximately 32.5% at 2<sup>0</sup> to 52.5% at 2<sup>5</sup>.
* **GenPRM-7B (Pass@1) (Blue line):** Accuracy increases from approximately 32.5% at 2<sup>0</sup> to 40% at 2<sup>5</sup>.
* **Maj. (Gray line):** Accuracy remains relatively flat around 37.5%.
* **GenPRM-7B (Maj@4) (Orange line):** Accuracy remains relatively flat around 42.5%.
* **GenPRM-7B (Maj@8) (Green line):** Accuracy remains relatively flat around 40%.
* **Direct GenPRM-7B (Red line):** Accuracy remains relatively flat around 37.5%.
* **Qwen2.5-Math-7B (Purple line):** Accuracy remains relatively flat around 37.5%.
* **Qwen2.5-Math-7B-PRM800K (Brown line):** Accuracy remains relatively flat around 37.5%.
* **Skywork-7B (Pink line):** Accuracy remains relatively flat around 37.5%.
* **Skywork-1.5B (Yellow-Green line):** Accuracy remains relatively flat around 37.5%.
#### (e) MATH (Gemma)
* **Pass@K (Gray dotted line):** Accuracy increases sharply from approximately 82% at 2<sup>0</sup> to 94% at 2<sup>5</sup>.
* **GenPRM-7B (Pass@1) (Blue line):** Accuracy increases from approximately 82% at 2<sup>0</sup> to 90% at 2<sup>5</sup>.
* **Maj. (Gray line):** Accuracy remains relatively flat around 84%.
* **GenPRM-7B (Maj@4) (Orange line):** Accuracy increases slightly from approximately 83% to 86%.
* **GenPRM-7B (Maj@8) (Green line):** Accuracy increases slightly from approximately 83% to 88%.
* **Direct GenPRM-7B (Red line):** Accuracy remains relatively flat around 84%.
* **Qwen2.5-Math-7B (Purple line):** Accuracy remains relatively flat around 85%.
* **Qwen2.5-Math-7B-PRM800K (Brown line):** Accuracy remains relatively flat around 84%.
* **Skywork-7B (Pink line):** Accuracy remains relatively flat around 85%.
* **Skywork-1.5B (Yellow-Green line):** Accuracy remains relatively flat around 84%.
#### (f) AMC23 (Gemma)
* **Pass@K (Gray dotted line):** Accuracy increases sharply from approximately 65% at 2<sup>0</sup> to 95% at 2<sup>8</sup>.
* **GenPRM-7B (Pass@1) (Blue line):** Accuracy increases from approximately 65% at 2<sup>0</sup> to 90% at 2<sup>8</sup>.
* **Maj. (Gray line):** Accuracy fluctuates between 70% and 75%.
* **GenPRM-7B (Maj@4) (Orange line):** Accuracy fluctuates between 75% and 85%.
* **GenPRM-7B (Maj@8) (Green line):** Accuracy fluctuates between 75% and 85%.
* **Direct GenPRM-7B (Red line):** Accuracy fluctuates between 70% and 75%.
* **Qwen2.5-Math-7B (Purple line):** Accuracy fluctuates between 75% and 80%.
* **Qwen2.5-Math-7B-PRM800K (Brown line):** Accuracy fluctuates between 70% and 75%.
* **Skywork-7B (Pink line):** Accuracy fluctuates between 75% and 80%.
* **Skywork-1.5B (Yellow-Green line):** Accuracy fluctuates between 70% and 75%.
#### (g) AIME24 (Gemma)
* **Pass@K (Gray dotted line):** Accuracy increases sharply from approximately 15% at 2<sup>0</sup> to 40% at 2<sup>8</sup>.
* **GenPRM-7B (Pass@1) (Blue line):** Accuracy increases from approximately 15% at 2<sup>0</sup> to 30% at 2<sup>8</sup>.
* **Maj. (Gray line):** Accuracy fluctuates between 15% and 20%.
* **GenPRM-7B (Maj@4) (Orange line):** Accuracy fluctuates between 20% and 25%.
* **GenPRM-7B (Maj@8) (Green line):** Accuracy fluctuates between 20% and 25%.
* **Direct GenPRM-7B (Red line):** Accuracy fluctuates between 15% and 20%.
* **Qwen2.5-Math-7B (Purple line):** Accuracy fluctuates between 20% and 25%.
* **Qwen2.5-Math-7B-PRM800K (Brown line):** Accuracy fluctuates between 15% and 20%.
* **Skywork-7B (Pink line):** Accuracy fluctuates between 20% and 25%.
* **Skywork-1.5B (Yellow-Green line):** Accuracy fluctuates between 15% and 20%.
#### (h) Minerva Math (Gemma)
* **Pass@K (Gray dotted line):** Accuracy increases sharply from approximately 30% at 2<sup>0</sup> to 52% at 2<sup>5</sup>.
* **GenPRM-7B (Pass@1) (Blue line):** Accuracy increases from approximately 30% at 2<sup>0</sup> to 40% at 2<sup>5</sup>.
* **Maj. (Gray line):** Accuracy remains relatively flat around 35%.
* **GenPRM-7B (Maj@4) (Orange line):** Accuracy remains relatively flat around 37%.
* **GenPRM-7B (Maj@8) (Green line):** Accuracy remains relatively flat around 37%.
* **Direct GenPRM-7B (Red line):** Accuracy remains relatively flat around 35%.
* **Qwen2.5-Math-7B (Purple line):** Accuracy remains relatively flat around 35%.
* **Qwen2.5-Math-7B-PRM800K (Brown line):** Accuracy remains relatively flat around 35%.
* **Skywork-7B (Pink line):** Accuracy remains relatively flat around 35%.
* **Skywork-1.5B (Yellow-Green line):** Accuracy remains relatively flat around 35%.
### Key Observations
* **Pass@K consistently outperforms other models** when the number of solutions increases, showing a steep upward trend in all charts.
* The performance of other models (GenPRM-7B variants, Qwen2.5-Math-7B, Skywork models) tends to plateau or fluctuate, with less significant improvements as the number of solutions increases.
* The AMC23 and AIME24 datasets show a wider range of accuracy values and more fluctuation compared to the MATH and Minerva Math datasets.
* The "Qwen" models generally show slightly better performance than the "Gemma" models, especially in the MATH and Minerva Math datasets.
### Interpretation
The charts demonstrate the impact of increasing the number of solutions (N) on the accuracy of different language models when solving math problems. The Pass@K model benefits significantly from a higher number of solutions, indicating its ability to leverage multiple attempts to find the correct answer. Other models show limited improvement with increasing N, suggesting they may be less effective at utilizing multiple solutions or have reached a performance ceiling.
The differences in performance across datasets (MATH, AMC23, AIME24, Minerva Math) highlight the varying difficulty and characteristics of these problem sets. The AMC23 and AIME24 datasets, with their wider accuracy ranges and fluctuations, may present more complex challenges for the models.
The comparison between "Qwen" and "Gemma" models suggests that the underlying architecture or training data of the "Qwen" models may provide a slight advantage in solving these math problems, particularly in the MATH and Minerva Math datasets.
DECODING INTELLIGENCE...
EXPERT: nemotron-free VERSION 1
RUNTIME: free/nvidia/nemotron-nano-12b-v2-vl:free
INTEL_VERIFIED
## Line Graphs: Model Accuracy vs. Number of Solutions Across Datasets
### Overview
The image contains eight line graphs comparing the accuracy of various AI models across four datasets (MATH, AMC23, AIME24, Minerva Math) as the number of solutions (N) increases. Each graph tests two problem sets (Qwen and Gemma) and evaluates models like Pass@K, GenPRM-7B variants, Direct GenPRM-7B, Qwen2.5-Math-7B, and Skywork models. Accuracy (%) is plotted against N (logarithmic scale: 2⁰ to 2⁸).
---
### Components/Axes
- **X-axis**: Number of Solutions (N) – Logarithmic scale (2⁰, 2¹, ..., 2⁸).
- **Y-axis**: Accuracy (%) – Ranges from ~30% to 95% depending on the dataset.
- **Legends**:
- **Colors**:
- Gray (dotted): Pass@K (baseline).
- Blue: GenPRM-7B (Pass@1).
- Green: GenPRM-7B (Maj@8).
- Orange: GenPRM-7B (Maj@4).
- Red: Direct GenPRM-7B.
- Purple: Qwen2.5-Math-7B.
- Pink: Skywork-7B.
- Brown: Qwen2.5-Math-7B-PRM800K.
- Yellow: Skywork-1.5B.
- **Placement**: Top-right corner of each graph.
---
### Detailed Analysis
#### (a) MATH (Qwen)
- **Trend**: Pass@K (gray dotted) slopes steeply upward (~85% at 2⁰ → ~94% at 2⁸).
- **Models**:
- GenPRM-7B (Pass@1, blue) starts at ~85% (2⁰) and reaches ~90% (2⁸).
- GenPRM-7B (Maj@8, green) peaks at ~91% (2⁸).
- Direct GenPRM-7B (red dashed) lags behind, peaking at ~88% (2⁸).
- **Key**: Pass@K dominates; GenPRM-7B variants improve with N.
#### (b) AMC23 (Qwen)
- **Trend**: Pass@K rises from ~70% (2⁰) to ~95% (2⁸).
- **Models**:
- GenPRM-7B (Maj@4, orange) peaks at ~88% (2⁶) then declines slightly.
- Qwen2.5-Math-7B (purple) stabilizes at ~85% (2⁸).
- **Key**: Maj@4 configuration underperforms at higher N.
#### (c) AIME24 (Qwen)
- **Trend**: Pass@K increases from ~35% (2⁰) to ~52% (2⁸).
- **Models**:
- GenPRM-7B (Pass@1, blue) reaches ~42% (2⁸).
- Skywork-7B (pink) peaks at ~38% (2⁸).
- **Key**: All models lag Pass@K; Skywork-7B performs better than GenPRM-7B.
#### (d) Minerva Math (Qwen)
- **Trend**: Pass@K rises from ~32% (2⁰) to ~53% (2⁸).
- **Models**:
- GenPRM-7B (Maj@8, green) peaks at ~42% (2⁸).
- Qwen2.5-Math-7B-PRM800K (brown) stabilizes at ~38% (2⁸).
- **Key**: Maj@8 configuration outperforms others.
#### (e) MATH (Gemma)
- **Trend**: Pass@K rises from ~82% (2⁰) to ~94% (2⁸).
- **Models**:
- GenPRM-7B (Pass@1, blue) reaches ~89% (2⁸).
- Skywork-1.5B (yellow) peaks at ~87% (2⁸).
- **Key**: Skywork-1.5B closely matches GenPRM-7B.
#### (f) AMC23 (Gemma)
- **Trend**: Pass@K increases from ~65% (2⁰) to ~95% (2⁸).
- **Models**:
- GenPRM-7B (Maj@4, orange) peaks at ~85% (2⁶) then drops.
- Qwen2.5-Math-7B (purple) stabilizes at ~80% (2⁸).
- **Key**: Maj@4 configuration shows overfitting.
#### (g) AIME24 (Gemma)
- **Trend**: Pass@K rises from ~15% (2⁰) to ~40% (2⁸).
- **Models**:
- GenPRM-7B (Pass@1, blue) reaches ~35% (2⁸).
- Skywork-7B (pink) peaks at ~32% (2⁸).
- **Key**: Skywork-7B slightly outperforms GenPRM-7B.
#### (h) Minerva Math (Gemma)
- **Trend**: Pass@K increases from ~30% (2⁰) to ~50% (2⁸).
- **Models**:
- GenPRM-7B (Maj@8, green) peaks at ~40% (2⁸).
- Skywork-1.5B (yellow) stabilizes at ~37% (2⁸).
- **Key**: Maj@8 configuration leads.
---
### Key Observations
1. **Pass@K Baseline**: Consistently outperforms all models across datasets.
2. **Model Variants**:
- GenPRM-7B (Maj@8) generally performs better than Pass@1 or Maj@4.
- Direct GenPRM-7B (red dashed) underperforms variants.
3. **Diminishing Returns**: Some models (e.g., GenPRM-7B Maj@4 in AMC23) plateau or decline at higher N.
4. **Skywork Models**: Competitive with GenPRM-7B in MATH and AIME24 but lag in AMC23.
---
### Interpretation
- **Scalability**: Increasing N improves accuracy, but gains diminish as N grows (e.g., AMC23 Qwen).
- **Model Efficiency**: GenPRM-7B variants with majority voting (Maj@8) often outperform simpler configurations.
- **Dataset-Specific Behavior**:
- AIME24 (high-difficulty math) shows the largest gap between models and Pass@K.
- Minerva Math (reasoning-focused) benefits more from majority voting.
- **Anomalies**:
- Direct GenPRM-7B (red dashed) consistently underperforms, suggesting architectural limitations.
- Skywork-1.5B matches GenPRM-7B in MATH but struggles in AMC23, indicating dataset-specific weaknesses.
This analysis highlights the trade-offs between model complexity, voting strategies, and dataset characteristics in solving math problems.
DECODING INTELLIGENCE...