## Line Chart: Loss vs. Epochs for MRL and SMRL
### Overview
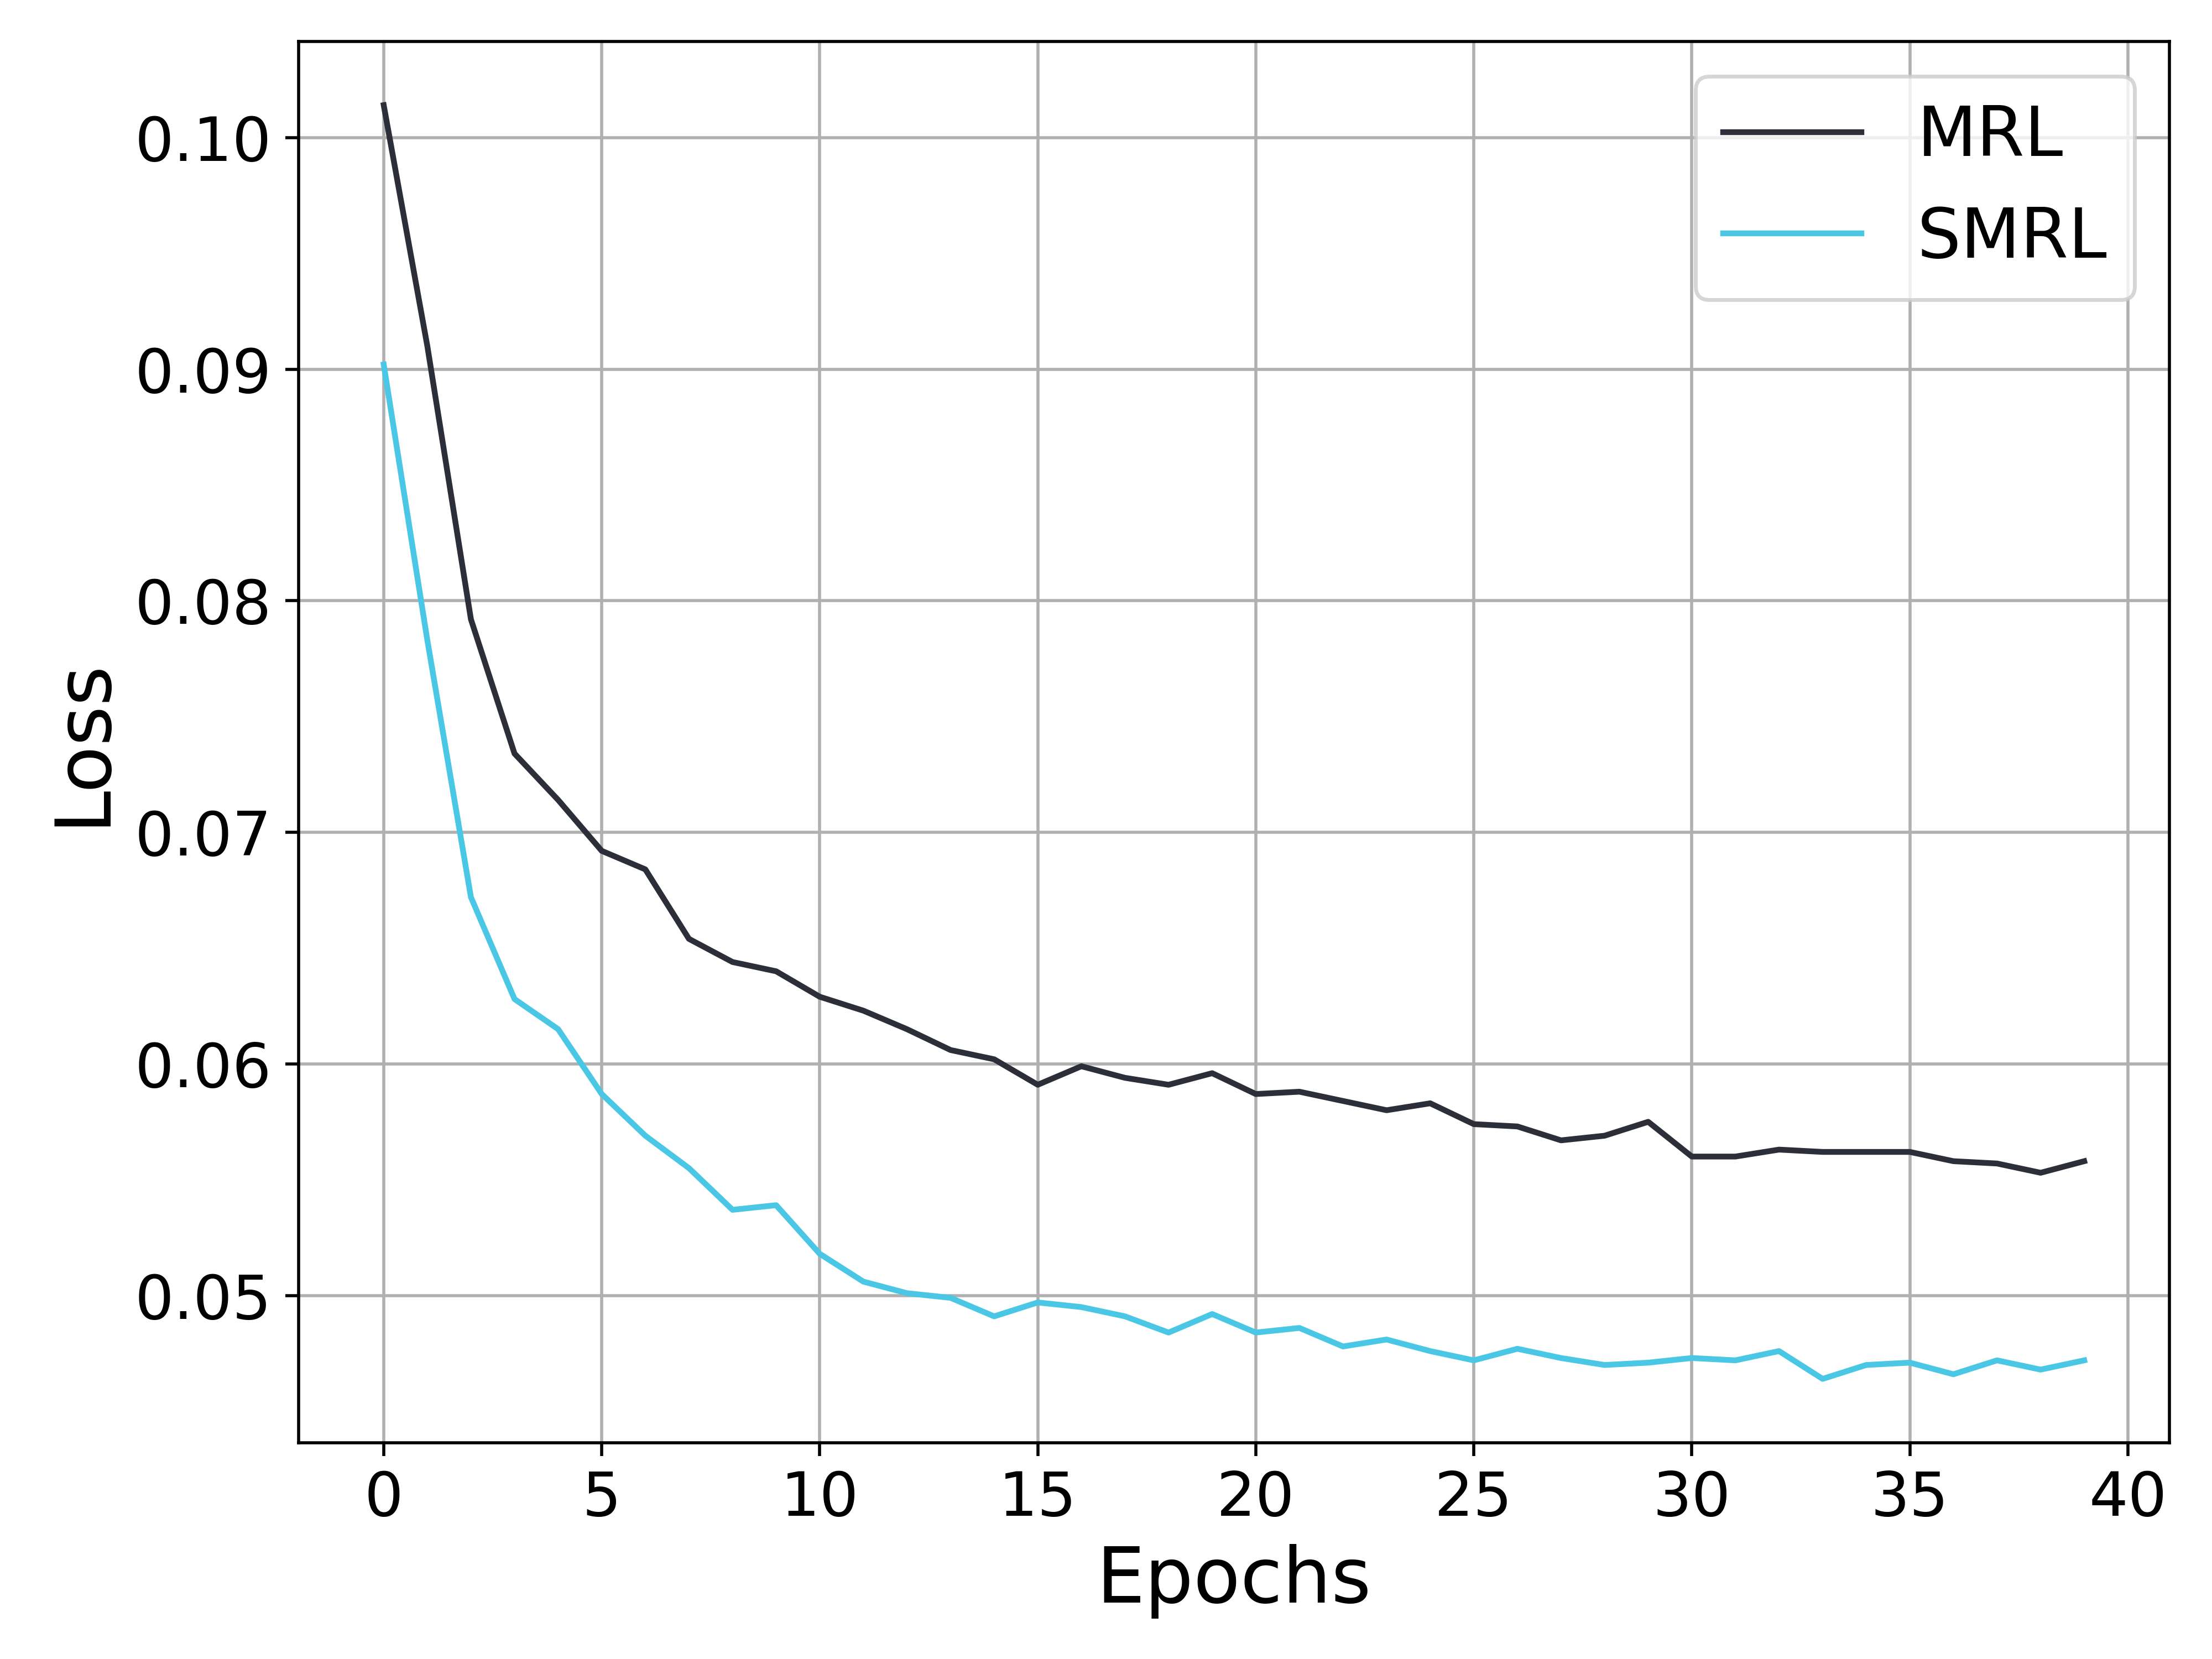
The image is a line chart comparing the loss of two models, MRL and SMRL, over 40 epochs. Both models show a decreasing loss over time, with SMRL consistently exhibiting a lower loss than MRL. The chart includes a grid for easier reading and a legend in the top-right corner.
### Components/Axes
* **X-axis:** Epochs, ranging from 0 to 40 in increments of 5.
* **Y-axis:** Loss, ranging from 0.05 to 0.10 in increments of 0.01.
* **Legend (Top-Right):**
* MRL (Black line)
* SMRL (Cyan line)
### Detailed Analysis
* **MRL (Black Line):**
* Trend: The loss decreases sharply in the initial epochs and then gradually stabilizes.
* Data Points:
* Epoch 0: Approximately 0.102
* Epoch 5: Approximately 0.069
* Epoch 10: Approximately 0.062
* Epoch 15: Approximately 0.059
* Epoch 20: Approximately 0.059
* Epoch 25: Approximately 0.058
* Epoch 30: Approximately 0.056
* Epoch 35: Approximately 0.056
* Epoch 40: Approximately 0.056
* **SMRL (Cyan Line):**
* Trend: The loss decreases rapidly in the early epochs and then fluctuates slightly around a lower value.
* Data Points:
* Epoch 0: Approximately 0.090
* Epoch 5: Approximately 0.060
* Epoch 10: Approximately 0.054
* Epoch 15: Approximately 0.049
* Epoch 20: Approximately 0.049
* Epoch 25: Approximately 0.047
* Epoch 30: Approximately 0.047
* Epoch 35: Approximately 0.047
* Epoch 40: Approximately 0.047
### Key Observations
* Both MRL and SMRL models show a significant reduction in loss during the first few epochs.
* SMRL consistently outperforms MRL, achieving a lower loss across all epochs.
* The rate of loss reduction decreases over time for both models, indicating convergence.
* After approximately 20 epochs, the loss for both models fluctuates within a narrow range.
### Interpretation
The chart demonstrates the training performance of two models, MRL and SMRL, by tracking their loss over 40 epochs. The data suggests that SMRL is a more effective model, as it achieves a lower loss compared to MRL throughout the training process. The rapid initial decrease in loss for both models indicates effective learning, while the subsequent stabilization suggests that the models are approaching their optimal performance levels. The fluctuations in loss after 20 epochs could be due to the learning rate or inherent noise in the training data.