\n
## Line Chart: Loss vs. Epochs for MRL and SMRL
### Overview
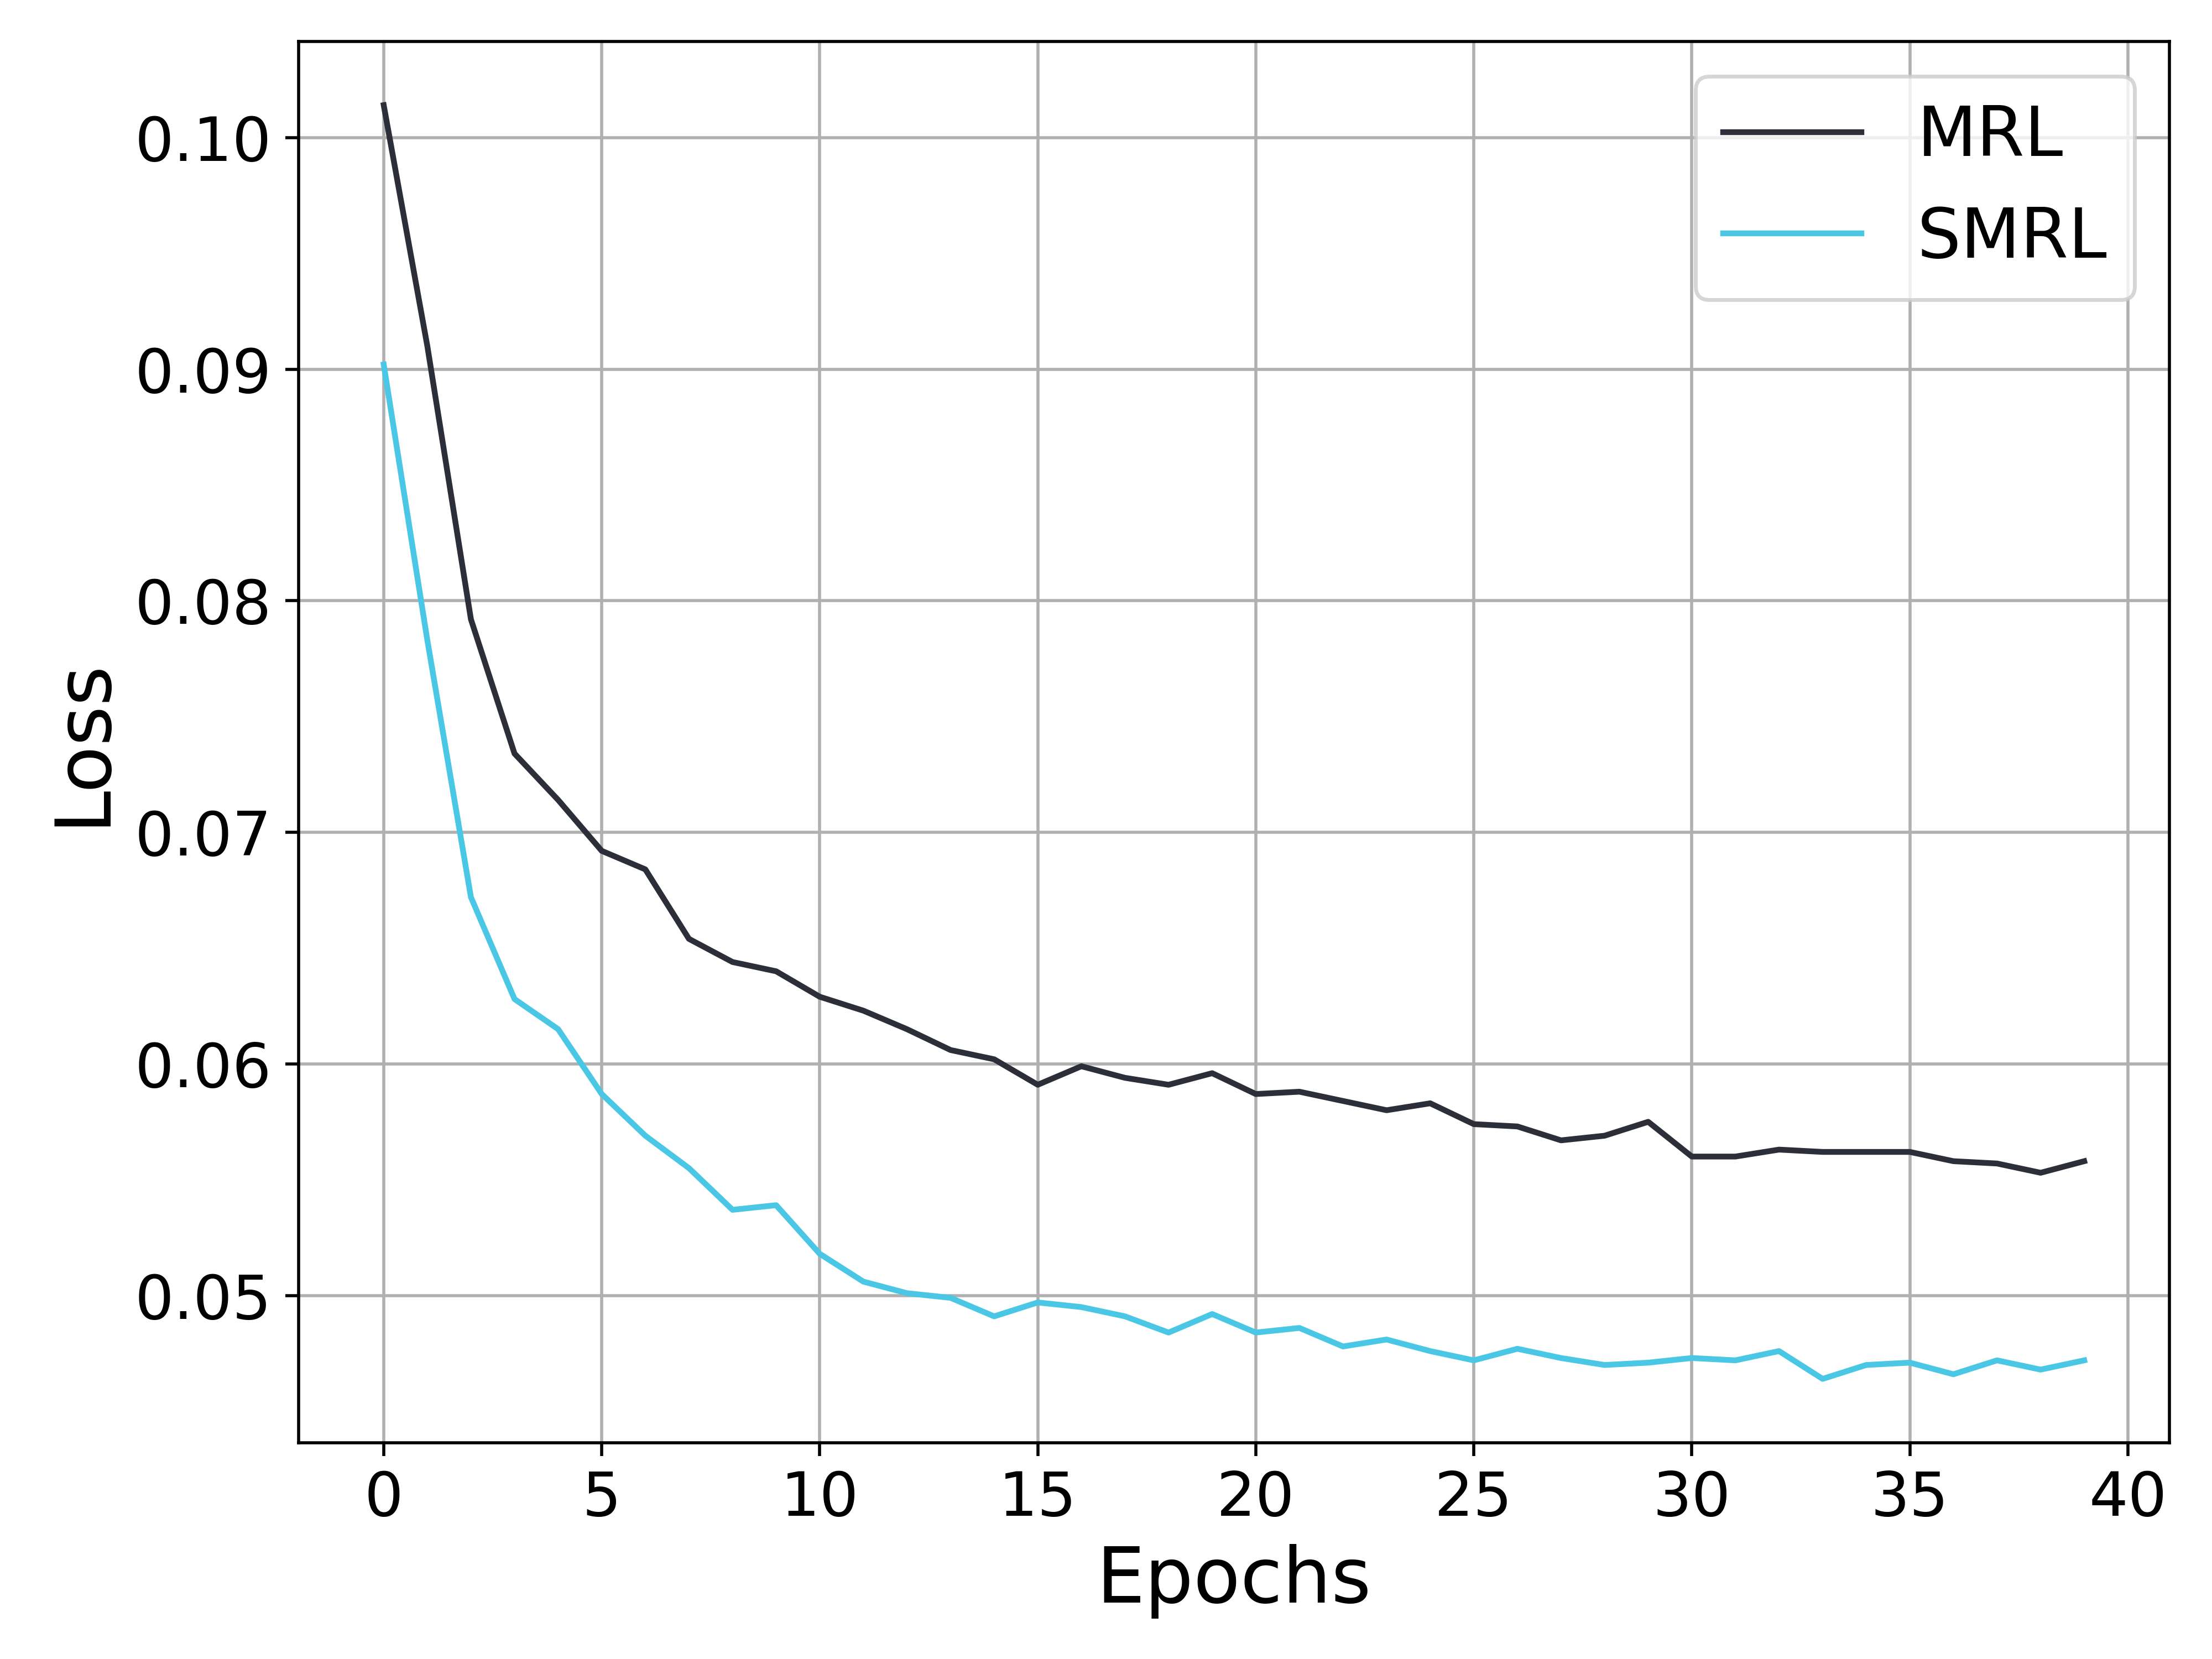
This image presents a line chart illustrating the relationship between 'Loss' and 'Epochs' for two different models: MRL and SMRL. The chart displays how the loss function changes as the models are trained over a number of epochs.
### Components/Axes
* **X-axis:** 'Epochs', ranging from 0 to 40, with tick marks at intervals of 5.
* **Y-axis:** 'Loss', ranging from 0.04 to 0.10, with tick marks at intervals of 0.01.
* **Data Series:** Two lines representing the loss values for MRL and SMRL.
* **Legend:** Located in the top-right corner, identifying the lines as 'MRL' (black) and 'SMRL' (cyan).
* **Grid:** A light gray grid is present to aid in reading values.
### Detailed Analysis
**MRL (Black Line):**
The MRL line starts at approximately 0.095 and generally slopes downward.
* Epoch 0: Loss ≈ 0.095
* Epoch 5: Loss ≈ 0.075
* Epoch 10: Loss ≈ 0.065
* Epoch 15: Loss ≈ 0.062
* Epoch 20: Loss ≈ 0.061
* Epoch 25: Loss ≈ 0.060
* Epoch 30: Loss ≈ 0.059
* Epoch 35: Loss ≈ 0.058
* Epoch 40: Loss ≈ 0.057
The line exhibits fluctuations after Epoch 20, indicating a potential plateau or oscillation in the learning process.
**SMRL (Cyan Line):**
The SMRL line begins at approximately 0.098 and demonstrates a steeper initial descent compared to MRL.
* Epoch 0: Loss ≈ 0.098
* Epoch 5: Loss ≈ 0.065
* Epoch 10: Loss ≈ 0.055
* Epoch 15: Loss ≈ 0.051
* Epoch 20: Loss ≈ 0.049
* Epoch 25: Loss ≈ 0.048
* Epoch 30: Loss ≈ 0.047
* Epoch 35: Loss ≈ 0.046
* Epoch 40: Loss ≈ 0.045
The SMRL line appears to converge more rapidly and smoothly than the MRL line, with less fluctuation after Epoch 20.
### Key Observations
* SMRL consistently exhibits lower loss values than MRL across all epochs.
* Both models demonstrate a decreasing loss trend, indicating successful learning.
* The rate of loss reduction slows down for both models as the number of epochs increases, suggesting convergence.
* MRL shows more pronounced oscillations in the loss function after Epoch 20, potentially indicating instability or a need for further tuning.
### Interpretation
The chart suggests that the SMRL model outperforms the MRL model in terms of loss reduction during training. The faster convergence and smoother loss curve of SMRL indicate that it learns more efficiently and potentially generalizes better than MRL. The oscillations observed in MRL's loss curve after Epoch 20 could be due to factors such as a high learning rate, noisy data, or an inadequate model capacity. Further investigation into the training process and model architecture may be necessary to address these issues and improve the performance of MRL. The data demonstrates a clear trend of diminishing returns as training progresses, highlighting the importance of early stopping or other regularization techniques to prevent overfitting. The difference in performance between the two models suggests that the specific techniques employed in SMRL are more effective for this particular task or dataset.