## Scatter Plot: professional_accounting
### Overview
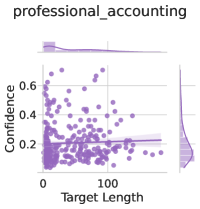
The image is a scatter plot titled "professional_accounting". It displays the relationship between "Target Length" on the x-axis and "Confidence" on the y-axis. The plot includes marginal distributions (histograms/density plots) along both axes. The data points are clustered, with a higher density of points at lower target lengths. A regression line with a confidence interval is also plotted.
### Components/Axes
* **Title:** professional\_accounting
* **X-axis:** Target Length
* Scale: 0 to 100
* **Y-axis:** Confidence
* Scale: 0 to 0.6
* **Data Points:** Lilac color
* **Regression Line:** Lilac color with a shaded confidence interval.
* **Marginal Distribution (Top):** Density plot of Target Length
* **Marginal Distribution (Right):** Density plot of Confidence
### Detailed Analysis
* **Target Length:**
* Ranges from approximately 0 to 100.
* The majority of data points are concentrated between 0 and 20.
* **Confidence:**
* Ranges from approximately 0 to 0.6.
* Most data points are clustered between 0 and 0.2.
* **Regression Line:**
* The regression line has a slight positive slope, indicating a weak positive correlation between Target Length and Confidence.
* The confidence interval around the regression line is relatively wide, suggesting a high degree of uncertainty in the relationship.
* **Data Point Distribution:**
* There is a dense cluster of points near the origin (low Target Length and low Confidence).
* As Target Length increases, the density of points decreases.
* There are few data points with high Target Length and high Confidence.
### Key Observations
* The majority of data points have low Target Length and low Confidence.
* There is a weak positive correlation between Target Length and Confidence.
* The relationship between Target Length and Confidence is highly variable.
### Interpretation
The scatter plot suggests that, for the "professional_accounting" category, shorter target lengths are more common. The confidence scores are generally low, with most values below 0.2. The weak positive correlation suggests that as the target length increases, the confidence tends to increase slightly, but this trend is not strong. The high density of points at low target lengths and low confidence indicates that these are the most frequent occurrences. The wide confidence interval around the regression line suggests that the relationship between target length and confidence is not well-defined and may be influenced by other factors.