\n
## Scatter Plot with Marginal Distributions: professional_accounting
### Overview
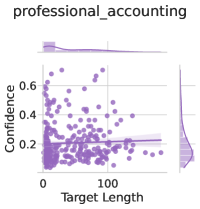
The image is a statistical visualization, specifically a scatter plot with marginal distribution plots (histograms or density plots) on the top and right sides. The chart is titled "professional_accounting" and explores the relationship between "Target Length" and "Confidence". The data is represented by purple points and distributions.
### Components/Axes
* **Title:** "professional_accounting" (located at the top center).
* **Main Plot Area:** A scatter plot.
* **X-Axis:**
* **Label:** "Target Length" (located at the bottom center).
* **Scale:** Linear scale ranging from 0 to approximately 150. Major tick marks are visible at 0 and 100.
* **Y-Axis:**
* **Label:** "Confidence" (located on the left side, rotated vertically).
* **Scale:** Linear scale ranging from 0.0 to approximately 0.7. Major tick marks are visible at 0.2, 0.4, and 0.6.
* **Data Series:** A single series of data points, all rendered in a medium purple color.
* **Marginal Plots:**
* **Top Marginal Plot:** A distribution plot (likely a histogram or kernel density estimate) aligned with the X-axis ("Target Length"). It is positioned above the main scatter plot.
* **Right Marginal Plot:** A distribution plot aligned with the Y-axis ("Confidence"). It is positioned to the right of the main scatter plot. Both marginal plots use the same purple color as the scatter points.
### Detailed Analysis
* **Data Point Distribution:** The scatter plot contains a high density of points, likely numbering in the hundreds.
* **Spatial Pattern & Trend:** The data shows a strong concentration in the lower-left quadrant of the plot. The highest density of points occurs where "Target Length" is between approximately 0 and 50, and "Confidence" is between 0.1 and 0.4. As "Target Length" increases beyond 50, the points become more sparse and show a wider spread in "Confidence" values, though the overall trend suggests a slight negative correlation—higher target lengths are associated with slightly lower confidence on average.
* **Marginal Distributions:**
* **Target Length (Top Plot):** The distribution is heavily right-skewed. The peak (mode) is near 0, with a long tail extending towards higher values (up to ~150). This indicates most samples have a short target length.
* **Confidence (Right Plot):** The distribution is unimodal and roughly symmetric, centered around a confidence value of approximately 0.25 to 0.3. The spread ranges from near 0.0 to about 0.65.
### Key Observations
1. **Cluster Dominance:** The vast majority of data points are clustered in a region of low target length and low-to-moderate confidence.
2. **Outliers:** There are a few outlier points with very high confidence (>0.6) at low target lengths (<20). There are also points with very high target length (>120) but with confidence values mostly below 0.4.
3. **Inverse Relationship Hint:** While noisy, the cloud of points suggests that as the target length increases, the maximum observed confidence tends to decrease. It is rare to see high confidence for long target lengths.
4. **Data Sparsity:** The plot becomes significantly sparser in the region where Target Length > 80 and Confidence > 0.4.
### Interpretation
This chart likely analyzes the performance of a model or system in the domain of "professional_accounting." The "Target Length" could represent the complexity, length of a document, or number of steps in an accounting task. "Confidence" likely represents the model's predicted probability or certainty in its output.
The data suggests that the system is most frequently applied to (or performs best on) tasks with short target lengths, where it achieves moderate confidence. The strong right-skew in target length indicates the dataset or evaluation is dominated by shorter tasks. The negative trend implies that as task complexity (length) increases, the system's confidence in its solutions tends to decrease and become more variable. The presence of high-confidence outliers on short tasks may represent easy, routine cases. The overall pattern could indicate a limitation in the system's ability to maintain high certainty when handling longer, more complex accounting problems.