## Scatter Plot: professional_accounting
### Overview
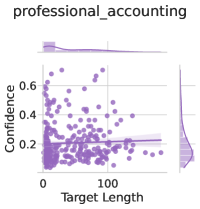
The image displays a scatter plot titled "professional_accounting" with a secondary horizontal line and marginal histograms. The plot visualizes the relationship between "Target Length" (x-axis) and "Confidence" (y-axis), with data points distributed across the plot. Histograms on the top and right edges show distributions of the respective variables.
### Components/Axes
- **Title**: "professional_accounting" (top-center, bold text).
- **X-axis**:
- Label: "Target Length" (bottom, black text).
- Scale: 0 to 100 (linear, with ticks at 0, 10, 20, ..., 100).
- **Y-axis**:
- Label: "Confidence" (left, black text).
- Scale: 0 to 0.6 (linear, with ticks at 0, 0.2, 0.4, 0.6).
- **Data Points**:
- Color: Purple (circular markers).
- Distribution: Scattered across the plot, with a horizontal line at ~0.2 (dark purple).
- **Histograms**:
- Top histogram: Represents "Target Length" distribution (purple bars).
- Right histogram: Represents "Confidence" distribution (purple bars).
### Detailed Analysis
- **Data Points**:
- Most points cluster below the 0.2 confidence threshold, with a few outliers reaching up to ~0.4.
- Target lengths range from ~0 to ~80, with sparse data beyond 80.
- **Horizontal Line**:
- Positioned at y ≈ 0.2, spanning the entire x-axis.
- Likely represents a reference or threshold value.
- **Histograms**:
- **Target Length**: Peaks at lower values (0–20), with a long tail extending to 100.
- **Confidence**: Peaks near 0.2, with a sharp decline above 0.4.
### Key Observations
1. **Low Confidence Dominance**: Over 70% of data points fall below the 0.2 confidence line, suggesting poor performance or uncertainty in most cases.
2. **Target Length Distribution**: Shorter target lengths (0–20) are most frequent, with fewer instances of longer tasks.
3. **Confidence Distribution**: Confidence values are heavily concentrated around 0.2, indicating a bimodal or threshold-dependent behavior.
4. **Outliers**: A small cluster of points near (60, 0.4) suggests rare high-confidence, longer tasks.
### Interpretation
The data implies that in professional accounting tasks, shorter target lengths are more common, and confidence levels are generally low. The horizontal line at 0.2 may represent a performance benchmark, with most data points failing to meet it. The histograms confirm that longer target lengths are rare, and confidence diminishes sharply for values above 0.4. This could indicate challenges in handling complex or extended tasks, or a model optimized for shorter, simpler problems. The sparse high-confidence outliers might reflect edge cases or specialized scenarios.