## Line Chart: Number of Detectors vs. Iteration Number
### Overview
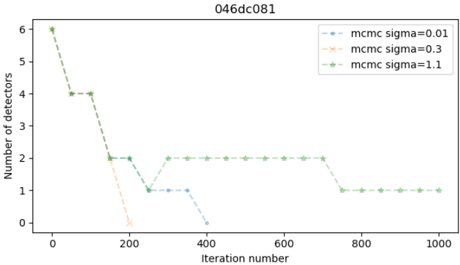
The image is a line chart displaying the number of detectors as a function of the iteration number for three different MCMC sigma values (0.01, 0.3, and 1.1). The chart shows how the number of detectors changes over iterations for each sigma value.
### Components/Axes
* **Title:** 046dc081
* **X-axis:** Iteration number, ranging from 0 to 1000 in increments of 200.
* **Y-axis:** Number of detectors, ranging from 0 to 6 in increments of 1.
* **Legend (Top-Right):**
* Blue dashed line with star markers: mcmc sigma=0.01
* Orange dashed line with x markers: mcmc sigma=0.3
* Green dashed line with star markers: mcmc sigma=1.1
### Detailed Analysis
* **mcmc sigma=0.01 (Blue):**
* The line starts at approximately (250, 1) and decreases to approximately (400, 0). The line is not present before x=250.
* **mcmc sigma=0.3 (Orange):**
* The line starts at approximately (200, 0). The line is not present after x=200.
* **mcmc sigma=1.1 (Green):**
* The line starts at approximately (0, 6), decreases to approximately (100, 4), remains at approximately 4 until x=200, decreases to approximately (200, 2), increases to approximately (300, 2), remains at approximately 2 until x=750, decreases to approximately (800, 1), and remains at approximately 1 until x=1000.
### Key Observations
* The number of detectors generally decreases as the iteration number increases, especially for mcmc sigma=1.1.
* mcmc sigma=0.3 has the fewest detectors and is only present at x=200.
* mcmc sigma=0.01 has a low number of detectors and is only present between x=250 and x=400.
* mcmc sigma=1.1 has the most detectors at the beginning, but it decreases and stabilizes at a low value.
### Interpretation
The chart illustrates the convergence behavior of a detector system under different MCMC sigma values. A higher sigma value (1.1) initially detects more objects, but the number of detections decreases and stabilizes over iterations. Lower sigma values (0.01 and 0.3) result in fewer detections. The data suggests that the choice of sigma value significantly impacts the detector performance and convergence. The optimal sigma value would depend on the specific application and desired trade-off between initial detection rate and convergence stability.