## Line Chart: Detector Count vs. Iteration Number for Different MCMC Sigma Values
### Overview
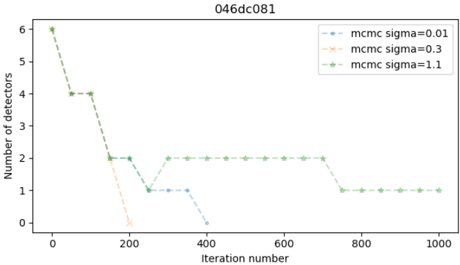
The image is a line chart titled "046dc081". It plots the "Number of detectors" on the y-axis against the "iteration number" on the x-axis for three different experimental conditions, distinguished by the sigma (σ) parameter of an MCMC (Markov Chain Monte Carlo) process. The chart shows how the number of detectors changes over 1000 iterations for each sigma value.
### Components/Axes
* **Title:** "046dc081" (centered at the top).
* **Y-Axis:** Labeled "Number of detectors". The scale runs from 0 to 6 with major tick marks at every integer (0, 1, 2, 3, 4, 5, 6).
* **X-Axis:** Labeled "iteration number". The scale runs from 0 to 1000 with major tick marks at 0, 200, 400, 600, 800, and 1000.
* **Legend:** Located in the top-right corner of the plot area. It contains three entries:
1. `mcmc sigma=0.01` (represented by a blue dashed line with circular markers).
2. `mcmc sigma=0.3` (represented by an orange dashed line with circular markers).
3. `mcmc sigma=1.1` (represented by a green dashed line with circular markers).
### Detailed Analysis
The chart displays three distinct data series, each showing a generally decreasing trend in the number of detectors over iterations, but with different rates and final values.
**1. Data Series: `mcmc sigma=0.01` (Blue Line)**
* **Trend:** Shows a stepwise, monotonic decrease. It starts high, drops in distinct steps, and eventually reaches zero.
* **Approximate Data Points:**
* Iteration 0: 6 detectors
* Iteration ~50: Drops to 4 detectors
* Iteration ~150: Drops to 2 detectors
* Iteration ~250: Drops to 1 detector
* Iteration ~400: Drops to 0 detectors and remains at 0 for the rest of the plotted iterations (up to 1000).
**2. Data Series: `mcmc sigma=0.3` (Orange Line)**
* **Trend:** Shows the most rapid decrease. It starts at the same point as the others but converges to zero much faster.
* **Approximate Data Points:**
* Iteration 0: 6 detectors
* Iteration ~50: Drops to 4 detectors
* Iteration ~150: Drops to 2 detectors
* Iteration ~200: Drops to 0 detectors and remains at 0 for the rest of the plotted iterations.
**3. Data Series: `mcmc sigma=1.1` (Green Line)**
* **Trend:** Shows a slower, stepwise decrease that eventually stabilizes at a non-zero value. It has the longest plateau.
* **Approximate Data Points:**
* Iteration 0: 6 detectors
* Iteration ~50: Drops to 4 detectors
* Iteration ~150: Drops to 2 detectors
* Iteration ~250: Drops to 1 detector
* Iteration ~300: Increases slightly back to 2 detectors.
* Iteration ~300 to ~700: Plateaus at 2 detectors.
* Iteration ~750: Drops to 1 detector.
* Iteration ~750 to 1000: Plateaus at 1 detector.
### Key Observations
1. **Convergence to Zero:** Both the `sigma=0.01` and `sigma=0.3` series converge to 0 detectors. The `sigma=0.3` series converges significantly faster (by iteration ~200) than the `sigma=0.01` series (by iteration ~400).
2. **Non-Zero Plateau:** The `sigma=1.1` series is the only one that does not converge to zero. It stabilizes at 1 detector after iteration ~750, following a long plateau at 2 detectors.
3. **Initial Behavior:** All three series begin at the same point (6 detectors at iteration 0) and follow a similar initial drop to 4 detectors by iteration ~50.
4. **Anomaly in Green Line:** The `sigma=1.1` (green) line shows a brief increase from 1 back to 2 detectors around iteration 250-300, which is not seen in the other series. This suggests a temporary reversal or instability in the process for this higher sigma value.
### Interpretation
This chart likely visualizes the results of a model selection or parameter estimation process using MCMC, where the "number of detectors" represents a model complexity or a count of significant features. The sigma parameter controls the step size or proposal distribution width in the MCMC algorithm.
* **Effect of Sigma:** The data suggests a clear relationship between the sigma value and the convergence behavior. A very small sigma (0.01) leads to slow, cautious exploration, resulting in a gradual reduction to zero. A moderate sigma (0.3) allows for faster convergence to the same endpoint (zero). A large sigma (1.1) causes more aggressive exploration, which in this case prevents the process from settling at zero, instead getting "stuck" at a local minimum or a simpler but non-null model (1 detector).
* **Underlying Process:** The stepwise decreases imply that the number of detectors is an integer-valued parameter that is being reduced in discrete steps as the MCMC chain progresses. The plateaus represent periods where the chain is sampling models with the same detector count.
* **Practical Implication:** The choice of sigma is critical. Too small, and convergence is slow. Too large, and the algorithm may fail to find the simplest model (zero detectors) and instead converge to a sub-optimal solution. The `sigma=0.3` setting appears to be the most efficient for reaching the zero-detector state in this specific scenario. The anomaly in the green line highlights the potential for non-monotonic behavior and instability with high sigma values.