## Line Chart: mcmc Detector Counts vs Iterations
### Overview
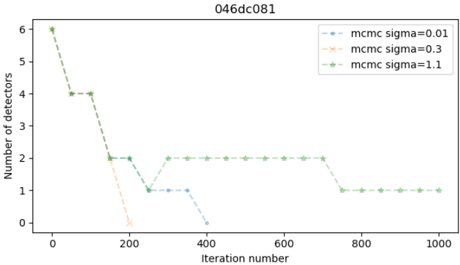
The chart displays three decaying line series representing the number of detectors remaining across 1000 iterations for different mcmc (Markov Chain Monte Carlo) simulations with varying sigma (σ) values. The y-axis shows detector counts (0-6), while the x-axis represents iteration steps (0-1000). Three distinct decay patterns emerge based on σ values.
### Components/Axes
- **X-axis**: "Iteration number" (0-1000, linear scale)
- **Y-axis**: "Number of detectors" (0-6, linear scale)
- **Legend**: Located in top-right corner with three entries:
- Blue dashed line: mcmc sigma=0.01
- Orange cross markers: mcmc sigma=0.3
- Green dot markers: mcmc sigma=1.1
### Detailed Analysis
1. **Green Series (σ=1.1)**:
- Starts at 6 detectors at iteration 0
- Drops to 4 at iteration 100
- Falls to 2 at iteration 200
- Remains stable at 2 until iteration 1000
- Shows gradual, stepwise decay with plateaus
2. **Orange Series (σ=0.3)**:
- Begins at 4 detectors at iteration 0
- Plummets to 0 by iteration 200
- Remains at 0 for all subsequent iterations
- Exhibits abrupt, non-recovering decay
3. **Blue Series (σ=0.01)**:
- Starts at 6 detectors at iteration 0
- Drops to 1 at iteration 200
- Falls to 0 at iteration 400
- Remains at 0 until iteration 1000
- Shows intermediate decay rate between σ=0.3 and σ=1.1
### Key Observations
- Higher σ values (1.1) maintain more stable detector counts longer
- Lower σ values (0.01) show faster but more gradual decay
- σ=0.3 causes complete detector loss by iteration 200
- All series plateau after initial decay, suggesting convergence
- σ=1.1 maintains 2 detectors (33% of initial) longest
### Interpretation
The data demonstrates an inverse relationship between σ values and detector retention duration. Higher σ (1.1) correlates with greater system stability, maintaining 2 detectors through 1000 iterations. Lower σ values (0.01-0.3) indicate increasing system sensitivity, with σ=0.3 causing total detector failure by iteration 200. The σ=0.01 series shows intermediate behavior, suggesting a threshold effect where σ below 0.1 leads to complete system collapse. This pattern implies σ tuning is critical for maintaining detector functionality in mcmc simulations, with σ=1.1 representing an optimal stability point for this parameter configuration.