TECHNICAL ASSET FINGERPRINT
68944658450611daeb650331
Click to view fullscreen
Press ESC or click to close
FOUND IN PAPERS
EXPERT: gemini-2.0-flash VERSION 1
RUNTIME: nugit/gemini/gemini-2.0-flash
INTEL_VERIFIED
## Diagram: R-PRM SFT and R-PRM DPO Training Process
### Overview
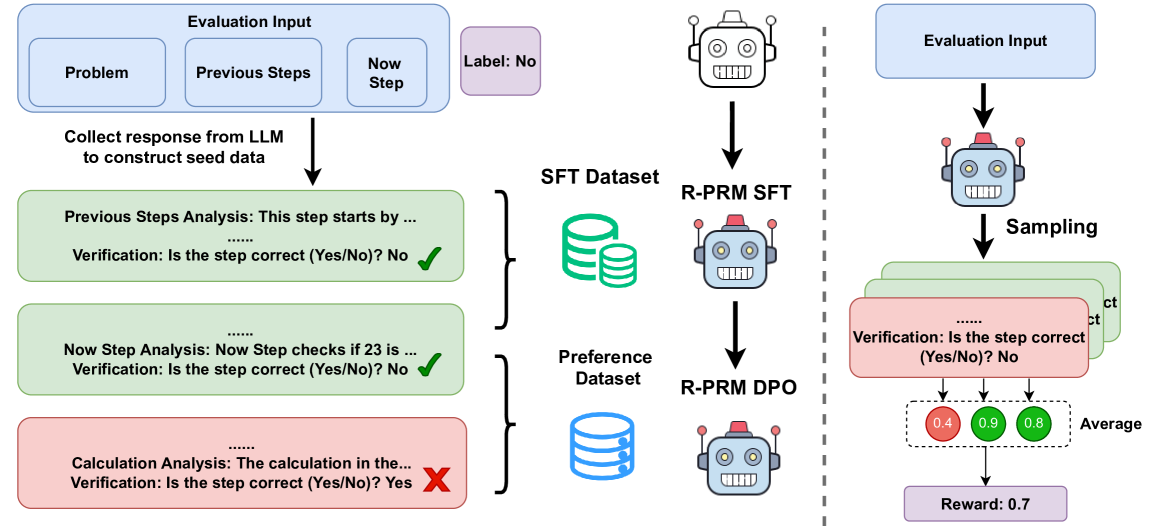
The image illustrates the training process for R-PRM SFT (Supervised Fine-Tuning) and R-PRM DPO (Direct Preference Optimization) models. It shows the flow of data from evaluation inputs, through LLM responses, datasets, and finally to the trained models. The diagram is split into two main sections, one for SFT and one for DPO, separated by a dashed vertical line.
### Components/Axes
**Left Side (SFT):**
* **Evaluation Input:** A blue rounded rectangle containing three smaller rectangles labeled "Problem", "Previous Steps", and "Now Step".
* **Label:** A purple rounded rectangle labeled "Label: No".
* **LLM Response Collection:** Text "Collect response from LLM to construct seed data" with a downward arrow.
* **Analysis Blocks:** Three rounded rectangles representing analysis steps:
* Green: "Previous Steps Analysis: This step starts by ... Verification: Is the step correct (Yes/No)? No" with a green checkmark.
* Green: "Now Step Analysis: Now Step checks if 23 is ... Verification: Is the step correct (Yes/No)? No" with a green checkmark.
* Red: "Calculation Analysis: The calculation in the... Verification: Is the step correct (Yes/No)? Yes" with a red X mark.
* **SFT Dataset:** A green database icon labeled "SFT Dataset".
* **R-PRM SFT:** A robot icon labeled "R-PRM SFT".
* **Preference Dataset:** A blue database icon labeled "Preference Dataset".
* **R-PRM DPO:** A robot icon labeled "R-PRM DPO".
**Right Side (DPO):**
* **Evaluation Input:** A blue rounded rectangle labeled "Evaluation Input".
* **Sampling:** Text "Sampling" with a downward arrow.
* **Analysis Blocks:** Stack of rounded rectangles representing analysis steps, alternating between green and red. The visible text is "Verification: Is the step correct (Yes/No)? No".
* **Average Scores:** Three colored circles with values:
* Red: "0.4"
* Green: "0.9"
* Green: "0.8"
* Text: "Average"
* **Reward:** A purple rounded rectangle labeled "Reward: 0.7".
### Detailed Analysis
**Left Side (SFT):**
1. **Evaluation Input:** The process begins with an evaluation input consisting of a problem, previous steps, and the current step. The label is "No", indicating a negative example or a step that needs correction.
2. **LLM Response Collection:** The LLM (Language Model) generates a response based on the input, which is then used to create seed data.
3. **Analysis Blocks:**
* The "Previous Steps Analysis" block is green, indicating that the previous steps are correct. The verification result is "No", but the checkmark suggests overall correctness.
* The "Now Step Analysis" block is also green, indicating that the current step is correct. The verification result is "No", but the checkmark suggests overall correctness.
* The "Calculation Analysis" block is red, indicating an error in the calculation. The verification result is "Yes", but the red X mark suggests the calculation is incorrect.
4. **SFT Dataset:** The data from the analysis blocks is used to create the SFT dataset.
5. **R-PRM SFT:** The SFT dataset is used to train the R-PRM SFT model.
6. **Preference Dataset:** The data from the analysis blocks is also used to create the Preference dataset.
7. **R-PRM DPO:** The Preference dataset is used to train the R-PRM DPO model.
**Right Side (DPO):**
1. **Evaluation Input:** The process begins with an evaluation input.
2. **Sampling:** Samples are drawn from the evaluation input.
3. **Analysis Blocks:** The sampled data is analyzed, resulting in a stack of analysis blocks, alternating between green and red, indicating correct and incorrect steps.
4. **Average Scores:** The analysis results are averaged, resulting in three scores: 0.4 (red), 0.9 (green), and 0.8 (green).
5. **Reward:** The average scores are used to calculate a reward of 0.7.
### Key Observations
* The diagram highlights the difference between SFT and DPO training processes.
* The SFT process involves explicit analysis of each step, while the DPO process involves sampling and averaging.
* The color-coding (green for correct, red for incorrect) provides a visual representation of the correctness of each step.
* The average scores in the DPO process provide a quantitative measure of the overall correctness of the sampled data.
### Interpretation
The diagram illustrates two different approaches to training models: Supervised Fine-Tuning (SFT) and Direct Preference Optimization (DPO). SFT involves explicitly labeling and correcting each step in the process, while DPO involves sampling and averaging, allowing the model to learn from preferences rather than explicit corrections. The diagram suggests that DPO may be a more efficient approach, as it does not require explicit analysis of each step. The reward of 0.7 in the DPO process indicates that the model is learning to generate correct steps, even though some individual steps may be incorrect. The diagram highlights the importance of both explicit correction (SFT) and preference learning (DPO) in training models.
DECODING INTELLIGENCE...
EXPERT: gemini-3.1-flash-lite-preview-free VERSION 1
RUNTIME: google-free/gemini-3.1-flash-lite-preview
INTEL_VERIFIED
## Diagram: LLM Training and Evaluation Workflow (R-PRM)
### Overview
The image presents a technical workflow diagram divided into two distinct sections by a vertical dashed line. The left section illustrates the process of constructing training datasets (SFT and Preference) for a Process Reward Model (R-PRM) based on step-by-step analysis. The right section illustrates the inference and evaluation process, where the model generates samples, verifies them, and calculates an averaged reward score.
### Components/Axes
**Left Section (Data Construction):**
* **Top:** "Evaluation Input" box containing three sub-components: "Problem", "Previous Steps", and "Now Step".
* **Label:** A purple box labeled "Label: No" positioned to the right of the Evaluation Input.
* **Process Flow:** An arrow labeled "Collect response from LLM to construct seed data" points downward to a sequence of analysis blocks.
* **Analysis Blocks:**
* **Block 1 (Green):** "Previous Steps Analysis: This step starts by ... Verification: Is the step correct (Yes/No)? No" (marked with a green checkmark).
* **Block 2 (Green):** "Now Step Analysis: Now Step checks if 23 is ... Verification: Is the step correct (Yes/No)? No" (marked with a green checkmark).
* **Block 3 (Red):** "Calculation Analysis: The calculation in the... Verification: Is the step correct (Yes/No)? Yes" (marked with a red X).
* **Datasets/Models:**
* "SFT Dataset" (represented by a stack of coins) leads to "R-PRM SFT" (represented by a robot icon).
* "Preference Dataset" (represented by a stack of coins) leads to "R-PRM DPO" (represented by a robot icon).
**Right Section (Inference/Evaluation):**
* **Top:** "Evaluation Input" box.
* **Process Flow:**
* Arrow points to a robot icon.
* Arrow labeled "Sampling" points to a stack of three overlapping boxes.
* **Verification Box:** "Verification: Is the step correct (Yes/No)? No".
* **Calculation:** A dashed box containing three circles with values: 0.4 (Red), 0.9 (Green), 0.8 (Green).
* **Label:** "Average" text next to the dashed box.
* **Final Output:** Arrow points to "Reward: 0.7".
### Detailed Analysis
**Left Side (Data Generation Logic):**
* The process begins with an "Evaluation Input" which is labeled "No" (indicating the overall solution or step is incorrect).
* The system performs a step-by-step analysis.
* The first two steps ("Previous Steps Analysis" and "Now Step Analysis") are verified as "No" (incorrect), indicated by green checkmarks.
* The final step ("Calculation Analysis") is verified as "Yes" (correct), indicated by a red X.
* This structured analysis is used to populate two distinct datasets:
* **SFT Dataset:** Used for "R-PRM SFT" (Supervised Fine-Tuning).
* **Preference Dataset:** Used for "R-PRM DPO" (Direct Preference Optimization).
**Right Side (Reward Calculation Logic):**
* The model takes an "Evaluation Input".
* Through "Sampling", the model generates multiple potential paths or verification outcomes.
* The verification process yields three distinct scores: 0.4, 0.9, and 0.8.
* **Mathematical Verification:** The average of these three values is calculated: $(0.4 + 0.9 + 0.8) / 3 = 2.1 / 3 = 0.7$.
* The final output is a "Reward" score of 0.7.
### Key Observations
* **Color Coding:** The diagram uses color to denote status. On the left, green checkmarks are associated with "No" (incorrect steps), and a red X is associated with "Yes" (correct step). On the right, the circles are color-coded: 0.4 is red (low score), while 0.9 and 0.8 are green (high scores).
* **Asymmetry:** The left side is about *training* (creating datasets from analysis), while the right side is about *inference* (using the model to generate a reward).
* **Verification Logic:** The diagram implies that the "Verification" step is the core mechanism for both training data generation and final reward assignment.
### Interpretation
This diagram outlines the architecture for training and utilizing a **Process Reward Model (PRM)**.
* **Training Phase (Left):** The diagram demonstrates a method of "Chain-of-Thought" verification. By breaking down a problem into steps and verifying each step (Previous, Now, Calculation), the system creates high-quality training data. The "Label: No" at the top suggests that the system is being trained to identify *why* a solution is incorrect by pinpointing the specific step where the error occurred.
* **Inference Phase (Right):** This demonstrates how the PRM acts as a verifier. Instead of relying on a single output, the model samples multiple verification paths. By averaging these scores, the system produces a more robust and reliable "Reward" signal (0.7 in this example), which helps in ranking model outputs or guiding reinforcement learning processes.
* **Peircean Investigative Note:** The diagram suggests that the "correctness" of a complex task is not binary but probabilistic. By aggregating multiple verification samples, the system mitigates the risk of a single incorrect verification, leading to a more nuanced reward signal.
DECODING INTELLIGENCE...
EXPERT: gemini-3.1-pro-preview VERSION 1
RUNTIME: gemini/gemini-3.1-pro-preview
INTEL_VERIFIED
## Diagram: R-PRM Training and Reward Generation Pipeline
### Overview
This image is a technical system architecture diagram illustrating a two-part machine learning pipeline. The left side depicts the data collection and training process for a Process Reward Model (R-PRM) using Supervised Fine-Tuning (SFT) and Direct Preference Optimization (DPO). The right side, separated by a vertical dashed line, demonstrates the inference phase where the trained model evaluates an input through sampling to calculate a final average reward score.
*Language Declaration:* All text in this image is in English. No other languages are present.
### Components
The diagram utilizes several distinct visual components to convey information:
* **Containers:** Rounded rectangles in various colors (light blue, light green, light red, purple) representing data inputs, outputs, and analytical steps.
* **Icons:**
* A basic white robot head (representing a base Large Language Model).
* A blue robot head with a red siren/light on top (representing the specialized R-PRM model).
* Stacked green coins/disks (representing the SFT Dataset).
* Stacked blue disks (representing the Preference Dataset).
* Green checkmarks ($\checkmark$) and red crosses ($\times$) indicating correctness.
* **Connectors:** Solid black arrows indicating process flow and data movement. Curly brackets grouping data elements.
* **Dividers:** A vertical dashed gray line separating the training phase (left) from the inference phase (right). A dashed rectangular box grouping numerical scores.
### Content Details
#### Left Section: Training Pipeline (Data Collection & Model Training)
**1. Input Generation (Top Left):**
* A large light blue box is labeled **"Evaluation Input"**.
* Inside this box are three smaller light blue boxes labeled: **"Problem"**, **"Previous Steps"**, and **"Now Step"**.
* To the right of the Evaluation Input box is a small purple box labeled **"Label: No"**.
* Below the Evaluation Input box, text reads: **"Collect response from LLM to construct seed data"**. A black arrow points downward from this text.
**2. Seed Data Construction (Middle Left):**
Below the arrow are three horizontal boxes representing generated analyses.
* **Box 1 (Light Green):**
* Text: "Previous Steps Analysis: This step starts by ..."
* Text: "......"
* Text: "Verification: Is the step correct (Yes/No)? No"
* Symbol: A large green checkmark ($\checkmark$) is positioned at the bottom right.
* **Box 2 (Light Green):**
* Text: "......"
* Text: "Now Step Analysis: Now Step checks if 23 is ..."
* Text: "Verification: Is the step correct (Yes/No)? No"
* Symbol: A large green checkmark ($\checkmark$) is positioned at the bottom right.
* **Box 3 (Light Red):**
* Text: "......"
* Text: "Calculation Analysis: The calculation in the..."
* Text: "Verification: Is the step correct (Yes/No)? Yes"
* Symbol: A large red 'X' ($\times$) is positioned at the bottom right.
**3. Dataset Creation and Model Training (Center Column):**
* A black curly bracket groups **Box 1** and **Box 2** (the green boxes). This bracket points to a green stacked-disk icon labeled **"SFT Dataset"**.
* A second black curly bracket groups **Box 2** (green) and **Box 3** (red). This bracket points to a blue stacked-disk icon labeled **"Preference Dataset"**.
* Above the datasets, a white robot icon has a downward arrow pointing to text **"R-PRM SFT"**.
* Below "R-PRM SFT" is a blue robot icon. A downward arrow points from it to text **"R-PRM DPO"**.
* Below "R-PRM DPO" is another instance of the blue robot icon, representing the final trained model.
#### Right Section: Inference Pipeline (Evaluation & Reward)
**1. Input and Model (Top Right):**
* A light blue box labeled **"Evaluation Input"** sits at the top.
* A downward arrow points to the blue robot icon (the trained R-PRM model).
**2. Sampling and Verification (Middle Right):**
* A downward arrow labeled **"Sampling"** points from the blue robot to a stack of three overlapping boxes.
* The front box is light red. The text inside reads:
* "......"
* "Verification: Is the step correct (Yes/No)? No"
* The two boxes behind it are light green. The letters "ct" (likely the end of the word "correct") are visible on the right edge of the middle box.
**3. Reward Calculation (Bottom Right):**
* Three downward arrows point from the stacked boxes into a dashed rectangular outline.
* Inside the dashed outline are three colored circles containing numbers:
* Red circle: **"0.4"**
* Green circle: **"0.9"**
* Green circle: **"0.8"**
* To the right of the dashed outline is the word **"Average"**.
* A downward arrow points from the dashed outline to a purple box labeled **"Reward: 0.7"**.
### Key Observations
* **Color Coding:** Green is consistently used to denote correct verifications or positive outcomes (checkmarks, SFT dataset, high scores). Red is used to denote incorrect verifications or negative outcomes (X marks, low scores). Light blue denotes inputs, and purple denotes final labels/rewards.
* **Mathematical Consistency:** In the reward calculation phase, the three sampled scores are 0.4, 0.9, and 0.8. The sum of these is 2.1. Divided by 3 (to find the average), the result is exactly 0.7, which matches the final "Reward: 0.7" box.
* **Dataset Grouping:** The SFT (Supervised Fine-Tuning) dataset is built exclusively from "correct" (green) examples. The Preference Dataset for DPO (Direct Preference Optimization) is built by contrasting a "correct" (green) example with an "incorrect" (red) example.
### Interpretation
This diagram outlines a sophisticated methodology for training a Process Reward Model (R-PRM) designed to evaluate the step-by-step reasoning of Large Language Models (LLMs).
**The Training Phase (Left):**
The system begins by taking a mathematical or logical problem, its previous steps, and the current step being evaluated. A base LLM generates analyses of these steps.
Crucially, the system evaluates the LLM's own verification of the steps. If the LLM correctly identifies a step as flawed (Green boxes: "Is the step correct? No" -> $\checkmark$), this good behavior is packaged into an **SFT Dataset** to teach the model basic competence.
To make the model highly robust, a **Preference Dataset** is created by pairing a correct verification (Green box) against an incorrect verification (Red box: "Is the step correct? Yes" -> $\times$ when it shouldn't be). This paired data is used for **DPO (Direct Preference Optimization)**, which trains the model to actively prefer the correct analytical reasoning over the flawed reasoning. The evolution of the robot icon from white to blue-with-a-siren visually represents the model gaining this specialized "evaluator/police" capability.
**The Inference Phase (Right):**
Once trained, the R-PRM is put to work. When given a new "Evaluation Input", it doesn't just generate one answer. It uses a **Sampling** technique, generating multiple verification paths (represented by the stacked boxes).
Each sampled path yields a confidence score (0.4, 0.9, 0.8). The red circle for 0.4 correlates with the red box in the sample stack, indicating a lower confidence or a negative verification path, while the green circles (0.9, 0.8) represent higher confidence/positive paths. By averaging these sampled scores, the system produces a final, stabilized **Reward** of 0.7.
*Reading between the lines:* This architecture suggests an attempt to mitigate LLM hallucinations in complex reasoning tasks (like math or coding). By training a model specifically to verify individual steps (Process Reward) rather than just the final answer (Outcome Reward), and by using multi-path sampling to smooth out anomalies, the resulting reward score is likely much more reliable for guiding reinforcement learning or search algorithms (like Monte Carlo Tree Search).
DECODING INTELLIGENCE...
EXPERT: nemotron-free VERSION 1
RUNTIME: free/nvidia/nemotron-nano-12b-v2-vl:free
INTEL_VERIFIED
## Flowchart: Evaluation Process for Step Verification and Reward Calculation
### Overview
The diagram illustrates a multi-stage evaluation process for verifying the correctness of computational steps and calculating rewards based on verification outcomes. It combines textual analysis, dataset management, and probabilistic modeling components.
### Components/Axes
1. **Left Section (Evaluation Input & Analysis)**
- **Input Boxes**:
- Problem
- Previous Steps
- Now Step
- Label: No
- **Analysis Blocks**:
- Previous Steps Analysis (green)
- Now Step Analysis (green)
- Calculation Analysis (red)
- **Verification Checks**:
- Yes/No? (with checkmarks ✓ and X marks)
- **Color Coding**:
- Green: Correct steps
- Red: Incorrect steps
2. **Right Section (Dataset & Reward Calculation)**
- **Datasets**:
- SFT Dataset (green disks)
- Reference Dataset (blue disks)
- **Models**:
- R-PRM SFT (robot icon)
- R-PRM DPO (robot icon)
- **Sampling Process**:
- Verification percentages: 0.4 (red), 0.9 (green), 0.8 (blue)
- Average Reward: 0.7 (purple box)
3. **Legend**:
- Red: Incorrect steps/verification
- Green: Correct steps/verification
- Blue: Reference dataset
- Purple: Average reward
### Detailed Analysis
1. **Left Section Flow**:
- Starts with problem definition and previous steps
- Progresses through three analysis stages:
- Previous Steps Analysis: Verified correct (✓)
- Now Step Analysis: Verified correct (✓)
- Calculation Analysis: Verified incorrect (×)
- Color progression: Green → Green → Red
2. **Right Section Flow**:
- Datasets feed into R-PRM models:
- SFT Dataset → R-PRM SFT
- Reference Dataset → R-PRM DPO
- Sampling process aggregates verification results:
- Red (0.4) + Green (0.9) + Blue (0.8) → Average Reward 0.7
### Key Observations
1. **Verification Accuracy**:
- 2/3 steps verified correct (66.7%)
- 1/3 step verified incorrect (33.3%)
2. **Reward Calculation**:
- Weighted average of verification scores
- Lower weight for incorrect verification (0.4)
- Higher weights for correct verifications (0.9 and 0.8)
3. **Color Consistency**:
- Red consistently marks incorrect elements
- Green marks correct elements
- Blue represents reference data
### Interpretation
This diagram demonstrates a systematic approach to evaluating computational steps through:
1. **Multi-stage Verification**: Combining direct step analysis with probabilistic modeling
2. **Reward Optimization**: Using weighted verification scores to calculate final rewards
3. **Dataset Integration**: Leveraging both supervised fine-tuning (SFT) and direct preference optimization (DPO) datasets
The process reveals that while most steps are verified correct, the calculation analysis stage requires improvement. The reward system effectively penalizes incorrect verifications while rewarding accurate assessments, suggesting a balanced approach to maintaining both accuracy and reliability in computational processes.
DECODING INTELLIGENCE...