## Diagram: R-PRM SFT and R-PRM DPO Training Process
### Overview
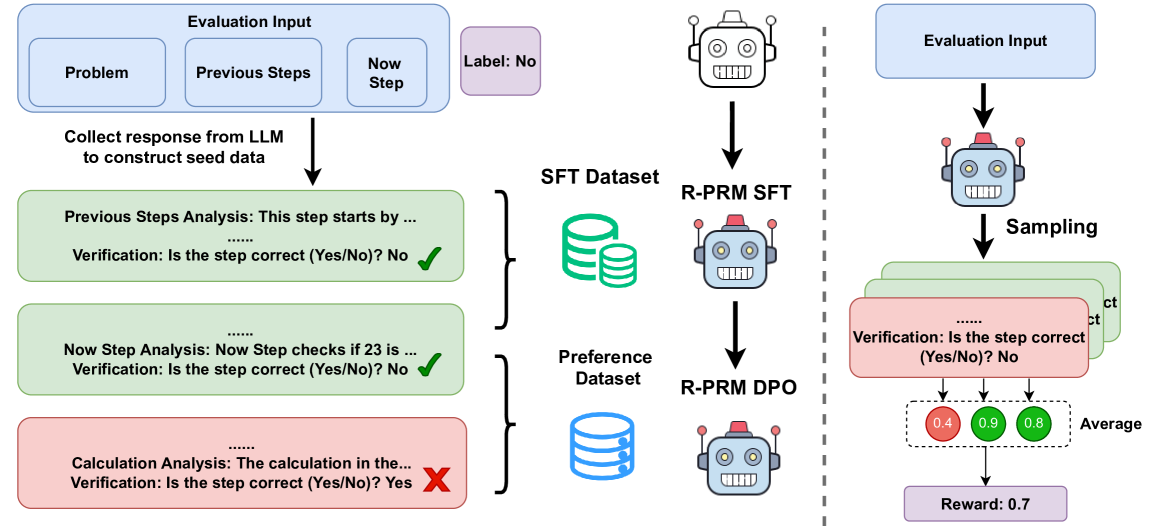
The image illustrates the training process for R-PRM SFT (Supervised Fine-Tuning) and R-PRM DPO (Direct Preference Optimization) models. It shows the flow of data from evaluation inputs, through LLM responses, datasets, and finally to the trained models. The diagram is split into two main sections, one for SFT and one for DPO, separated by a dashed vertical line.
### Components/Axes
**Left Side (SFT):**
* **Evaluation Input:** A blue rounded rectangle containing three smaller rectangles labeled "Problem", "Previous Steps", and "Now Step".
* **Label:** A purple rounded rectangle labeled "Label: No".
* **LLM Response Collection:** Text "Collect response from LLM to construct seed data" with a downward arrow.
* **Analysis Blocks:** Three rounded rectangles representing analysis steps:
* Green: "Previous Steps Analysis: This step starts by ... Verification: Is the step correct (Yes/No)? No" with a green checkmark.
* Green: "Now Step Analysis: Now Step checks if 23 is ... Verification: Is the step correct (Yes/No)? No" with a green checkmark.
* Red: "Calculation Analysis: The calculation in the... Verification: Is the step correct (Yes/No)? Yes" with a red X mark.
* **SFT Dataset:** A green database icon labeled "SFT Dataset".
* **R-PRM SFT:** A robot icon labeled "R-PRM SFT".
* **Preference Dataset:** A blue database icon labeled "Preference Dataset".
* **R-PRM DPO:** A robot icon labeled "R-PRM DPO".
**Right Side (DPO):**
* **Evaluation Input:** A blue rounded rectangle labeled "Evaluation Input".
* **Sampling:** Text "Sampling" with a downward arrow.
* **Analysis Blocks:** Stack of rounded rectangles representing analysis steps, alternating between green and red. The visible text is "Verification: Is the step correct (Yes/No)? No".
* **Average Scores:** Three colored circles with values:
* Red: "0.4"
* Green: "0.9"
* Green: "0.8"
* Text: "Average"
* **Reward:** A purple rounded rectangle labeled "Reward: 0.7".
### Detailed Analysis
**Left Side (SFT):**
1. **Evaluation Input:** The process begins with an evaluation input consisting of a problem, previous steps, and the current step. The label is "No", indicating a negative example or a step that needs correction.
2. **LLM Response Collection:** The LLM (Language Model) generates a response based on the input, which is then used to create seed data.
3. **Analysis Blocks:**
* The "Previous Steps Analysis" block is green, indicating that the previous steps are correct. The verification result is "No", but the checkmark suggests overall correctness.
* The "Now Step Analysis" block is also green, indicating that the current step is correct. The verification result is "No", but the checkmark suggests overall correctness.
* The "Calculation Analysis" block is red, indicating an error in the calculation. The verification result is "Yes", but the red X mark suggests the calculation is incorrect.
4. **SFT Dataset:** The data from the analysis blocks is used to create the SFT dataset.
5. **R-PRM SFT:** The SFT dataset is used to train the R-PRM SFT model.
6. **Preference Dataset:** The data from the analysis blocks is also used to create the Preference dataset.
7. **R-PRM DPO:** The Preference dataset is used to train the R-PRM DPO model.
**Right Side (DPO):**
1. **Evaluation Input:** The process begins with an evaluation input.
2. **Sampling:** Samples are drawn from the evaluation input.
3. **Analysis Blocks:** The sampled data is analyzed, resulting in a stack of analysis blocks, alternating between green and red, indicating correct and incorrect steps.
4. **Average Scores:** The analysis results are averaged, resulting in three scores: 0.4 (red), 0.9 (green), and 0.8 (green).
5. **Reward:** The average scores are used to calculate a reward of 0.7.
### Key Observations
* The diagram highlights the difference between SFT and DPO training processes.
* The SFT process involves explicit analysis of each step, while the DPO process involves sampling and averaging.
* The color-coding (green for correct, red for incorrect) provides a visual representation of the correctness of each step.
* The average scores in the DPO process provide a quantitative measure of the overall correctness of the sampled data.
### Interpretation
The diagram illustrates two different approaches to training models: Supervised Fine-Tuning (SFT) and Direct Preference Optimization (DPO). SFT involves explicitly labeling and correcting each step in the process, while DPO involves sampling and averaging, allowing the model to learn from preferences rather than explicit corrections. The diagram suggests that DPO may be a more efficient approach, as it does not require explicit analysis of each step. The reward of 0.7 in the DPO process indicates that the model is learning to generate correct steps, even though some individual steps may be incorrect. The diagram highlights the importance of both explicit correction (SFT) and preference learning (DPO) in training models.