## Diagram: LLM Training and Evaluation Workflow (R-PRM)
### Overview
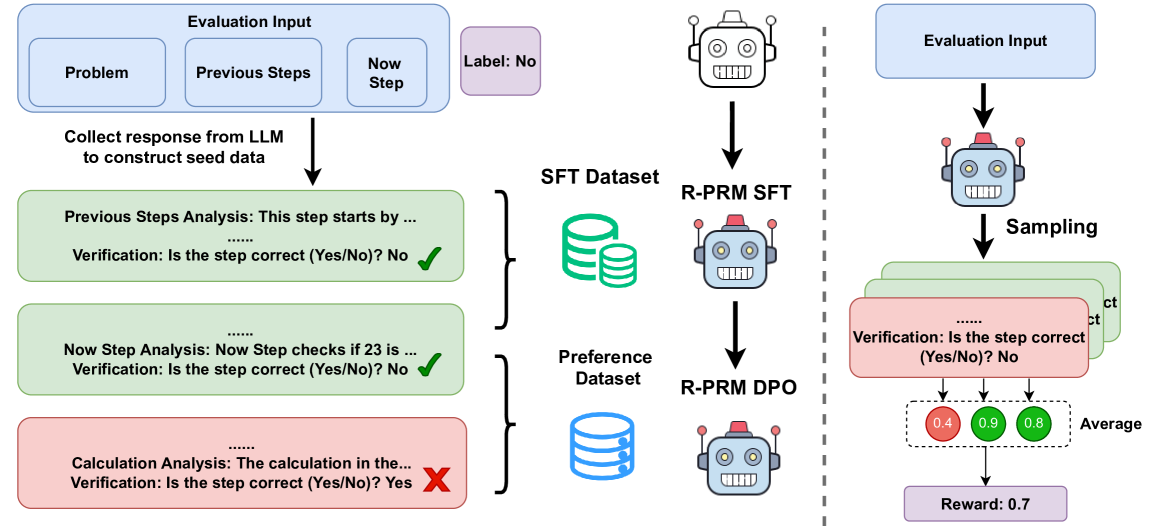
The image presents a technical workflow diagram divided into two distinct sections by a vertical dashed line. The left section illustrates the process of constructing training datasets (SFT and Preference) for a Process Reward Model (R-PRM) based on step-by-step analysis. The right section illustrates the inference and evaluation process, where the model generates samples, verifies them, and calculates an averaged reward score.
### Components/Axes
**Left Section (Data Construction):**
* **Top:** "Evaluation Input" box containing three sub-components: "Problem", "Previous Steps", and "Now Step".
* **Label:** A purple box labeled "Label: No" positioned to the right of the Evaluation Input.
* **Process Flow:** An arrow labeled "Collect response from LLM to construct seed data" points downward to a sequence of analysis blocks.
* **Analysis Blocks:**
* **Block 1 (Green):** "Previous Steps Analysis: This step starts by ... Verification: Is the step correct (Yes/No)? No" (marked with a green checkmark).
* **Block 2 (Green):** "Now Step Analysis: Now Step checks if 23 is ... Verification: Is the step correct (Yes/No)? No" (marked with a green checkmark).
* **Block 3 (Red):** "Calculation Analysis: The calculation in the... Verification: Is the step correct (Yes/No)? Yes" (marked with a red X).
* **Datasets/Models:**
* "SFT Dataset" (represented by a stack of coins) leads to "R-PRM SFT" (represented by a robot icon).
* "Preference Dataset" (represented by a stack of coins) leads to "R-PRM DPO" (represented by a robot icon).
**Right Section (Inference/Evaluation):**
* **Top:** "Evaluation Input" box.
* **Process Flow:**
* Arrow points to a robot icon.
* Arrow labeled "Sampling" points to a stack of three overlapping boxes.
* **Verification Box:** "Verification: Is the step correct (Yes/No)? No".
* **Calculation:** A dashed box containing three circles with values: 0.4 (Red), 0.9 (Green), 0.8 (Green).
* **Label:** "Average" text next to the dashed box.
* **Final Output:** Arrow points to "Reward: 0.7".
### Detailed Analysis
**Left Side (Data Generation Logic):**
* The process begins with an "Evaluation Input" which is labeled "No" (indicating the overall solution or step is incorrect).
* The system performs a step-by-step analysis.
* The first two steps ("Previous Steps Analysis" and "Now Step Analysis") are verified as "No" (incorrect), indicated by green checkmarks.
* The final step ("Calculation Analysis") is verified as "Yes" (correct), indicated by a red X.
* This structured analysis is used to populate two distinct datasets:
* **SFT Dataset:** Used for "R-PRM SFT" (Supervised Fine-Tuning).
* **Preference Dataset:** Used for "R-PRM DPO" (Direct Preference Optimization).
**Right Side (Reward Calculation Logic):**
* The model takes an "Evaluation Input".
* Through "Sampling", the model generates multiple potential paths or verification outcomes.
* The verification process yields three distinct scores: 0.4, 0.9, and 0.8.
* **Mathematical Verification:** The average of these three values is calculated: $(0.4 + 0.9 + 0.8) / 3 = 2.1 / 3 = 0.7$.
* The final output is a "Reward" score of 0.7.
### Key Observations
* **Color Coding:** The diagram uses color to denote status. On the left, green checkmarks are associated with "No" (incorrect steps), and a red X is associated with "Yes" (correct step). On the right, the circles are color-coded: 0.4 is red (low score), while 0.9 and 0.8 are green (high scores).
* **Asymmetry:** The left side is about *training* (creating datasets from analysis), while the right side is about *inference* (using the model to generate a reward).
* **Verification Logic:** The diagram implies that the "Verification" step is the core mechanism for both training data generation and final reward assignment.
### Interpretation
This diagram outlines the architecture for training and utilizing a **Process Reward Model (PRM)**.
* **Training Phase (Left):** The diagram demonstrates a method of "Chain-of-Thought" verification. By breaking down a problem into steps and verifying each step (Previous, Now, Calculation), the system creates high-quality training data. The "Label: No" at the top suggests that the system is being trained to identify *why* a solution is incorrect by pinpointing the specific step where the error occurred.
* **Inference Phase (Right):** This demonstrates how the PRM acts as a verifier. Instead of relying on a single output, the model samples multiple verification paths. By averaging these scores, the system produces a more robust and reliable "Reward" signal (0.7 in this example), which helps in ranking model outputs or guiding reinforcement learning processes.
* **Peircean Investigative Note:** The diagram suggests that the "correctness" of a complex task is not binary but probabilistic. By aggregating multiple verification samples, the system mitigates the risk of a single incorrect verification, leading to a more nuanced reward signal.