## Diagram: LLM Evaluation and Refinement Pipeline
### Overview
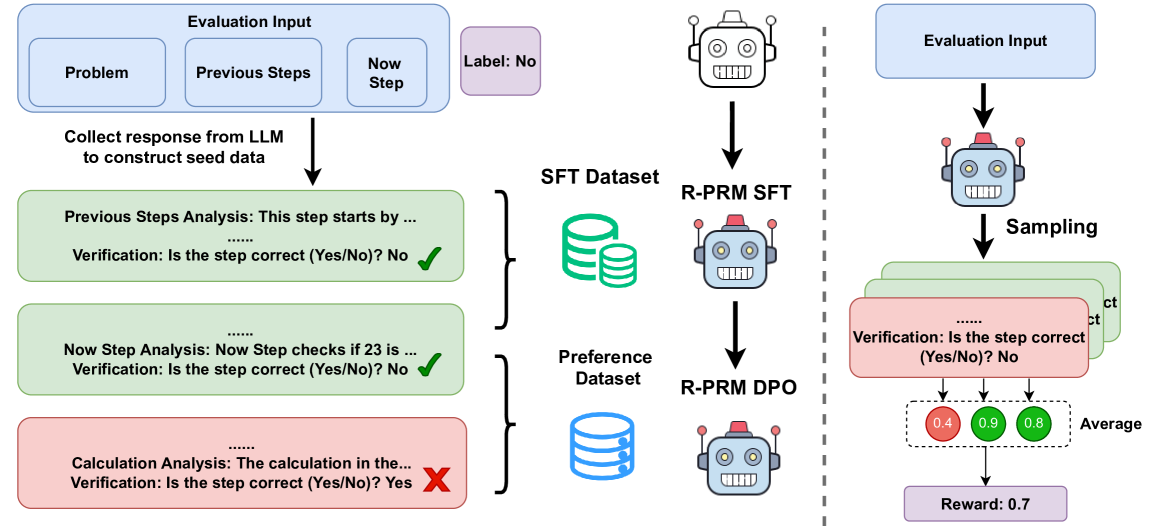
This diagram illustrates a pipeline for evaluating and refining Large Language Models (LLMs) using datasets, model training, and verification steps. The pipeline is split into two main branches: one focusing on Supervised Fine-Tuning (SFT) and the other on Direct Preference Optimization (DPO). The diagram highlights the flow of data, model training, and the evaluation process with associated rewards.
### Components/Axes
The diagram consists of several key components:
* **Evaluation Input:** Represented by a rectangular box divided into three sections: "Problem", "Previous Steps", and "Now Step".
* **LLM Representation:** A robotic head icon represents the LLM being evaluated and refined.
* **Datasets:** Two types of datasets are shown: "SFT Dataset" (represented by stacked books) and "Preference Dataset" (represented by a database cylinder).
* **Model Training:** "R-PRM SFT" and "R-PRM DPO" represent the model training stages using the respective datasets.
* **Verification Steps:** Text boxes with "Verification: Is the step correct (Yes/No)?" questions and associated checkmarks or 'X' marks.
* **Reward System:** Numerical values (0.4, 0.9, 0.8) representing rewards, with an "Average" reward of 0.7.
* **Arrows:** Indicate the flow of data and processes.
* **Vertical Dashed Line:** Separates the SFT and DPO branches.
### Detailed Analysis or Content Details
**Left Branch (SFT):**
1. **Evaluation Input:** The process starts with "Evaluation Input" containing "Problem", "Previous Steps", and "Now Step".
2. **LLM Response Collection:** "Collect response from LLM to construct seed data" is the first step.
3. **Previous Steps Analysis:** "Previous Steps Analysis: This step starts by..." followed by a verification step: "Verification: Is the step correct (Yes/No)? No" (marked with a red 'X').
4. **Now Step Analysis:** "Now Step Analysis: Now Step checks if 23 is..." followed by a verification step: "Verification: Is the step correct (Yes/No)? No" (marked with a green checkmark).
5. **Calculation Analysis:** "Calculation Analysis: The calculation in the..." followed by a verification step: "Verification: Is the step correct (Yes/No)? Yes" (marked with a red 'X').
6. **SFT Dataset & R-PRM SFT:** The SFT Dataset feeds into the "R-PRM SFT" model training stage.
**Right Branch (DPO):**
1. **Evaluation Input:** The process starts with "Evaluation Input".
2. **Sampling:** The LLM undergoes "Sampling".
3. **Verification & Reward:** Multiple verification steps are shown: "Verification: Is the step correct (Yes/No)?". Three reward values are displayed: 0.4 (light green), 0.9 (green), and 0.8 (dark green).
4. **Average Reward:** The "Average" reward is calculated as 0.7.
5. **Preference Dataset & R-PRM DPO:** The Preference Dataset feeds into the "R-PRM DPO" model training stage.
### Key Observations
* The SFT branch includes detailed analysis steps with verification, showing both correct and incorrect steps.
* The DPO branch focuses on sampling and reward assignment based on verification.
* The diagram visually separates the SFT and DPO approaches to LLM refinement.
* The reward values in the DPO branch suggest varying levels of correctness or preference.
* The "Label: No" text is positioned near the first verification step in the SFT branch.
### Interpretation
This diagram outlines a comprehensive approach to LLM evaluation and refinement. The SFT branch represents a more detailed, step-by-step analysis of the LLM's reasoning, while the DPO branch focuses on overall preference and reward. The use of both SFT and DPO suggests a hybrid approach to improving LLM performance. The verification steps and reward system provide a mechanism for quantifying the LLM's correctness and guiding its learning process. The presence of both positive (green checkmarks) and negative (red 'X' marks) verification results indicates that the LLM is not always correct and requires further refinement. The average reward of 0.7 suggests a moderate level of performance, indicating room for improvement. The diagram highlights the iterative nature of LLM development, where evaluation, analysis, and refinement are continuously performed to enhance the model's capabilities.