TECHNICAL ASSET FINGERPRINT
68944658450611daeb650331
Click to view fullscreen
Press ESC or click to close
FOUND IN PAPERS
EXPERT: healer-alpha-free VERSION 1
RUNTIME: free/openrouter/healer-alpha
INTEL_VERIFIED
## Diagram: R-PRM Training and Evaluation Pipeline
### Overview
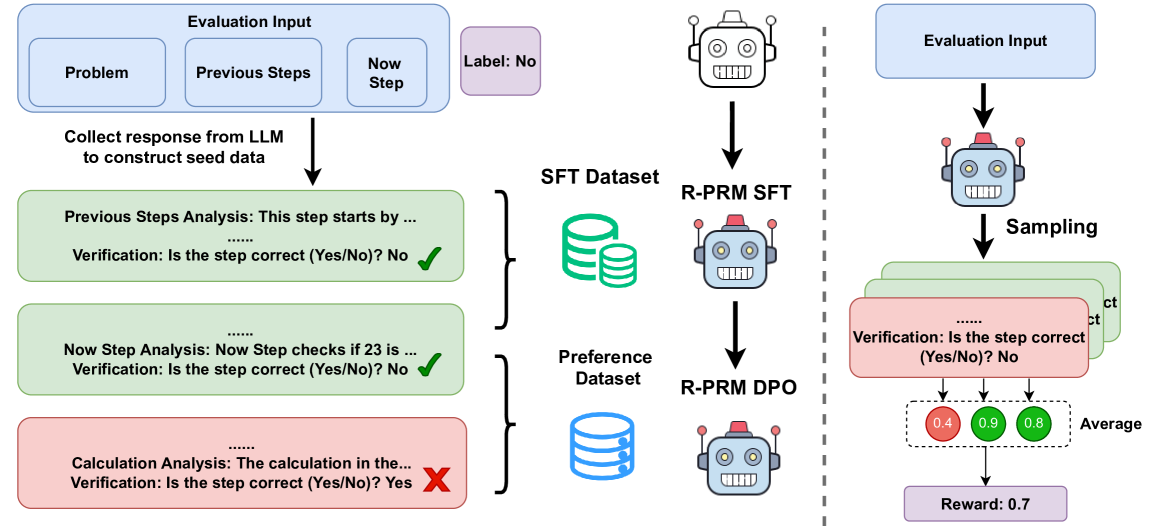
This image is a technical flowchart illustrating a two-phase pipeline for training and evaluating a Reward-Model for Process Reward (R-PRM). The diagram details how step-by-step verification data is generated from an LLM, used to create training datasets, and then applied to sample and compute a reward score. The process is divided into a **Data Construction Phase** (left of the dashed line) and an **Evaluation/Sampling Phase** (right of the dashed line).
### Components/Axes
The diagram is structured into two main sections separated by a vertical dashed line.
**Left Section: Data Construction & Training**
1. **Evaluation Input Block (Top-Left):** A light blue rounded rectangle containing three sub-boxes: `Problem`, `Previous Steps`, and `Now Step`. Adjacent to it is a purple box labeled `Label: No`.
2. **Data Generation Arrow:** An arrow points downward with the text: `Collect response from LLM to construct seed data`.
3. **Verification Step Boxes (Center-Left):** Three stacked boxes represent the analysis of different steps.
* **Top Green Box:** Contains text `Previous Steps Analysis: This step starts by ...` followed by `Verification: Is the step correct (Yes/No)? No` and a green checkmark (✓).
* **Middle Green Box:** Contains text `Now Step Analysis: Now Step checks if 23 is ...` followed by `Verification: Is the step correct (Yes/No)? No` and a green checkmark (✓).
* **Bottom Red Box:** Contains text `Calculation Analysis: The calculation in the...` followed by `Verification: Is the step correct (Yes/No)? Yes` and a red cross mark (✗).
4. **Dataset Icons (Center):** Two database icons.
* A green icon labeled `SFT Dataset`.
* A blue icon labeled `Preference Dataset`.
5. **Model Icons (Center-Right):** Two robot icons representing trained models.
* The top robot is labeled `R-PRM SFT` (Supervised Fine-Tuning).
* The bottom robot is labeled `R-PRM DPO` (Direct Preference Optimization).
* Arrows connect the `SFT Dataset` to the `R-PRM SFT` model and the `Preference Dataset` to the `R-PRM DPO` model.
**Right Section: Evaluation & Reward Calculation**
1. **Evaluation Input Block (Top-Right):** A light blue rounded rectangle identical to the one on the left.
2. **Model & Sampling (Center-Right):** An arrow points from the input to a robot icon. Below it, an arrow labeled `Sampling` points to a stack of three green boxes.
3. **Sampled Verification Boxes:** The stacked boxes are partially visible, with the top one showing `Verification: Is the step correct (Yes/No)? No`.
4. **Score Circles (Bottom-Right):** Three colored circles with numerical values, connected by arrows from the verification boxes.
* A red circle with the value `0.4`.
* A green circle with the value `0.9`.
* A green circle with the value `0.8`.
5. **Aggregation & Output:** Arrows from the score circles point to the label `Average`. A final arrow points to a purple box at the bottom labeled `Reward: 0.7`.
### Detailed Analysis
* **Data Flow (Left Side):** The process begins with an "Evaluation Input" consisting of a problem and its solution steps. An LLM generates responses to create seed data. Each step (Previous, Now, Calculation) is analyzed for correctness. The diagram shows a specific instance where the "Previous Steps" and "Now Step" analyses conclude the step is *incorrect* (Verification: No), while the "Calculation Analysis" concludes it is *correct* (Verification: Yes). This labeled data (correct/incorrect) is used to populate two distinct datasets: an **SFT Dataset** and a **Preference Dataset**. These datasets are then used to train two versions of the R-PRM model: one via Supervised Fine-Tuning (SFT) and another via Direct Preference Optimization (DPO).
* **Evaluation Flow (Right Side):** A new "Evaluation Input" is fed into a trained R-PRM model. The model performs "Sampling," generating multiple verification judgments for the steps. In the example, three samples are shown. The model outputs verification scores (0.4, 0.9, 0.8) for each sample. These scores are averaged to produce a final scalar `Reward: 0.7`. The color of the score circles (red for low, green for high) visually indicates the model's confidence or correctness assessment for each sample.
### Key Observations
1. **Contradictory Labels in Training Data:** In the left panel, the "Calculation Analysis" box has a `Verification: Yes` but is marked with a red cross (✗), while the other two boxes have `Verification: No` but are marked with green checkmarks (✓). This suggests the checkmark/cross may indicate the *ground truth label* (✓ = correct step, ✗ = incorrect step), while the "Verification: Yes/No" is the *model's prediction*. The `Label: No` at the top likely refers to the overall ground truth for the entire problem step.
2. **Two-Model Training Strategy:** The pipeline explicitly uses two different training methodologies (SFT and DPO) on two different datasets derived from the same verification process, indicating a sophisticated, multi-stage approach to training the reward model.
3. **Stochastic Evaluation:** The right panel shows that evaluation involves sampling multiple responses from the model, leading to a distribution of scores (0.4, 0.9, 0.8) that are aggregated into a single reward. This highlights the probabilistic nature of the model's judgment.
### Interpretation
This diagram outlines a methodology for training a **Process Reward Model (PRM)** that evaluates the correctness of individual reasoning steps in a problem-solving sequence, rather than just the final answer. The core innovation appears to be the automated generation of step-level verification data using an LLM, which is then used to train a dedicated reward model (R-PRM).
The pipeline suggests a focus on **improving the reliability of AI reasoning**. By breaking down a problem into steps and verifying each one, the system can identify *where* a solution fails, not just *that* it fails. The use of both SFT and DPO datasets implies the model is first taught to mimic correct verifications (SFT) and then refined to distinguish between better and worse reasoning paths (DPO).
The final "Reward" score (0.7) is not a simple correctness label but an **aggregated confidence metric** derived from multiple samples. This makes the reward signal more robust and nuanced, suitable for use in reinforcement learning from human feedback (RLHF) or similar alignment techniques to steer LLMs toward more logically sound and verifiable reasoning processes. The entire system represents a move from outcome-based to process-based evaluation and training of large language models.
DECODING INTELLIGENCE...