## Flowchart: Evaluation Process for Step Verification and Reward Calculation
### Overview
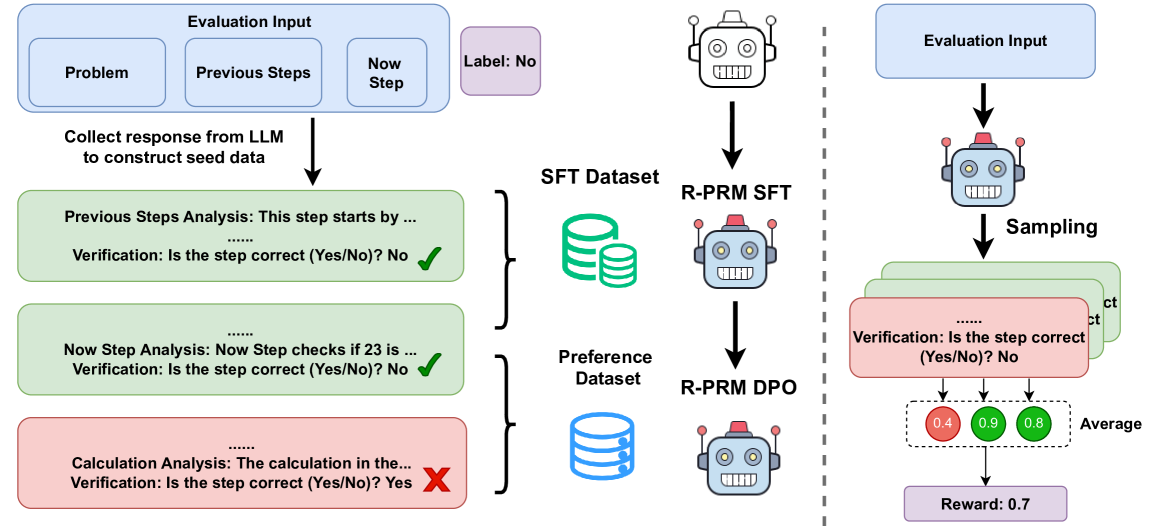
The diagram illustrates a multi-stage evaluation process for verifying the correctness of computational steps and calculating rewards based on verification outcomes. It combines textual analysis, dataset management, and probabilistic modeling components.
### Components/Axes
1. **Left Section (Evaluation Input & Analysis)**
- **Input Boxes**:
- Problem
- Previous Steps
- Now Step
- Label: No
- **Analysis Blocks**:
- Previous Steps Analysis (green)
- Now Step Analysis (green)
- Calculation Analysis (red)
- **Verification Checks**:
- Yes/No? (with checkmarks ✓ and X marks)
- **Color Coding**:
- Green: Correct steps
- Red: Incorrect steps
2. **Right Section (Dataset & Reward Calculation)**
- **Datasets**:
- SFT Dataset (green disks)
- Reference Dataset (blue disks)
- **Models**:
- R-PRM SFT (robot icon)
- R-PRM DPO (robot icon)
- **Sampling Process**:
- Verification percentages: 0.4 (red), 0.9 (green), 0.8 (blue)
- Average Reward: 0.7 (purple box)
3. **Legend**:
- Red: Incorrect steps/verification
- Green: Correct steps/verification
- Blue: Reference dataset
- Purple: Average reward
### Detailed Analysis
1. **Left Section Flow**:
- Starts with problem definition and previous steps
- Progresses through three analysis stages:
- Previous Steps Analysis: Verified correct (✓)
- Now Step Analysis: Verified correct (✓)
- Calculation Analysis: Verified incorrect (×)
- Color progression: Green → Green → Red
2. **Right Section Flow**:
- Datasets feed into R-PRM models:
- SFT Dataset → R-PRM SFT
- Reference Dataset → R-PRM DPO
- Sampling process aggregates verification results:
- Red (0.4) + Green (0.9) + Blue (0.8) → Average Reward 0.7
### Key Observations
1. **Verification Accuracy**:
- 2/3 steps verified correct (66.7%)
- 1/3 step verified incorrect (33.3%)
2. **Reward Calculation**:
- Weighted average of verification scores
- Lower weight for incorrect verification (0.4)
- Higher weights for correct verifications (0.9 and 0.8)
3. **Color Consistency**:
- Red consistently marks incorrect elements
- Green marks correct elements
- Blue represents reference data
### Interpretation
This diagram demonstrates a systematic approach to evaluating computational steps through:
1. **Multi-stage Verification**: Combining direct step analysis with probabilistic modeling
2. **Reward Optimization**: Using weighted verification scores to calculate final rewards
3. **Dataset Integration**: Leveraging both supervised fine-tuning (SFT) and direct preference optimization (DPO) datasets
The process reveals that while most steps are verified correct, the calculation analysis stage requires improvement. The reward system effectively penalizes incorrect verifications while rewarding accurate assessments, suggesting a balanced approach to maintaining both accuracy and reliability in computational processes.