## Scatter Plot: Number of WRITE pulses applied to recurrent layer and Loss vs. Probability scaling factor
### Overview
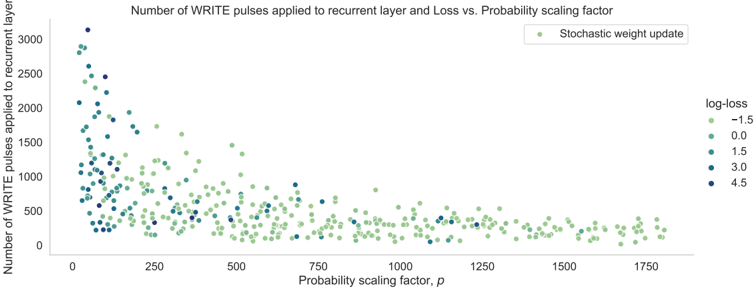
The image is a scatter plot showing the relationship between the number of WRITE pulses applied to a recurrent layer and the probability scaling factor, with data points colored according to log-loss values. The plot illustrates how the number of WRITE pulses changes with varying probability scaling factors and how this relationship is influenced by the log-loss.
### Components/Axes
* **Title:** Number of WRITE pulses applied to recurrent layer and Loss vs. Probability scaling factor
* **X-axis:** Probability scaling factor, *p*. Scale ranges from 0 to 1750, with tick marks at intervals of 250.
* **Y-axis:** Number of WRITE pulses applied to recurrent layer. Scale ranges from 0 to 3000, with tick marks at intervals of 500.
* **Legend (Top-Right):** Stochastic weight update (represented by green data points).
* **Colorbar (Right):** log-loss values ranging from -1.5 to 4.5.
* -1.5: Light Green
* 0.0: Green
* 1.5: Teal
* 3.0: Dark Teal
* 4.5: Dark Blue
### Detailed Analysis
The scatter plot displays data points colored according to their log-loss values. The x-axis represents the probability scaling factor, and the y-axis represents the number of WRITE pulses.
* **General Trend:** There is a general downward trend, indicating that as the probability scaling factor increases, the number of WRITE pulses tends to decrease.
* **Log-Loss Distribution:**
* **log-loss = -1.5 (Light Green):** These points are scattered throughout the plot, but are more prevalent at higher probability scaling factors (above 750).
* **log-loss = 0.0 (Green):** Similar to the light green points, these are also scattered, but are more concentrated at higher probability scaling factors.
* **log-loss = 1.5 (Teal):** These points are more concentrated at lower probability scaling factors (below 500) and higher number of WRITE pulses.
* **log-loss = 3.0 (Dark Teal):** These points are mostly found at lower probability scaling factors (below 500) and higher number of WRITE pulses.
* **log-loss = 4.5 (Dark Blue):** These points are almost exclusively found at very low probability scaling factors (below 250) and high number of WRITE pulses (above 1500).
### Key Observations
* The number of WRITE pulses is generally higher for lower probability scaling factors.
* Higher log-loss values (dark blue and dark teal) are associated with lower probability scaling factors and higher number of WRITE pulses.
* Lower log-loss values (light green and green) are associated with higher probability scaling factors and lower number of WRITE pulses.
* There is a significant amount of scatter in the data, indicating variability in the relationship between the variables.
### Interpretation
The plot suggests that the number of WRITE pulses required for the recurrent layer decreases as the probability scaling factor increases. The log-loss value appears to be correlated with both the number of WRITE pulses and the probability scaling factor. Higher log-loss values are associated with scenarios where fewer WRITE pulses are needed at lower probability scaling factors, potentially indicating a more efficient learning process under those conditions. Conversely, lower log-loss values are associated with higher probability scaling factors, suggesting that more WRITE pulses are needed to achieve similar performance. The scatter in the data indicates that other factors may also be influencing the relationship between these variables.