## Scatter Plot: Number of WRITE pulses applied to recurrent layer and Loss vs. Probability scaling factor
### Overview
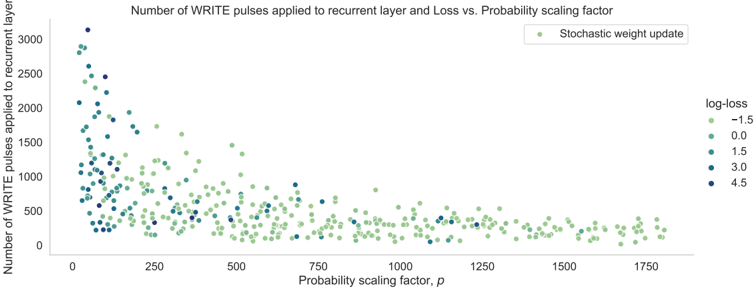
The image is a scatter plot visualizing the relationship between the **probability scaling factor (p)** and the **number of WRITE pulses applied to a recurrent layer**, with data points color-coded by **log-loss values**. The plot shows a clear inverse relationship between p and both the number of WRITE pulses and log-loss.
---
### Components/Axes
- **X-axis**: "Probability scaling factor, p" (range: 0 to 1750, linear scale).
- **Y-axis**: "Number of WRITE pulses applied to recurrent layer and Loss" (range: 0 to 3000, linear scale).
- **Legend**: Located in the top-right corner, mapping log-loss values to colors:
- **Light green**: log-loss = -1.5
- **Medium green**: log-loss = 0.0
- **Dark green**: log-loss = 1.5
- **Navy blue**: log-loss = 3.0
- **Dark blue**: log-loss = 4.5
---
### Detailed Analysis
1. **Data Distribution**:
- **High log-loss (4.5, dark blue)**: Concentrated in the **lower-left quadrant** (p ≈ 0–250, WRITE pulses ≈ 1000–3000).
- **Moderate log-loss (3.0, navy blue)**: Scattered in the **lower-middle region** (p ≈ 0–500, WRITE pulses ≈ 500–2000).
- **Low log-loss (1.5, dark green)**: Spread across **middle-right** (p ≈ 500–1000, WRITE pulses ≈ 200–1000).
- **Near-zero log-loss (0.0, medium green)**: Clustered in the **upper-middle** (p ≈ 1000–1500, WRITE pulses ≈ 100–500).
- **Best performance (log-loss = -1.5, light green)**: Dominates the **upper-right** (p ≈ 1500–1750, WRITE pulses ≈ 0–200).
2. **Trends**:
- **Inverse relationship**: As p increases, the number of WRITE pulses decreases sharply (e.g., p=0 → ~3000 pulses; p=1750 → ~0 pulses).
- **Log-loss improvement**: Higher p values correlate with progressively lighter colors (lower log-loss), indicating better model performance.
- **Outliers**: A few dark blue points (log-loss=4.5) persist at p > 500, suggesting suboptimal performance in some cases despite higher p.
---
### Key Observations
- **Performance vs. Efficiency**: Higher p values reduce computational cost (fewer WRITE pulses) while improving model accuracy (lower log-loss).
- **Threshold Effect**: A significant drop in WRITE pulses occurs between p=500 and p=1000, coinciding with log-loss improvement from 3.0 to 1.5.
- **Saturation**: Beyond p=1500, WRITE pulses plateau near zero, but log-loss remains slightly negative (-1.5), suggesting diminishing returns.
---
### Interpretation
The data demonstrates that **probability scaling factor (p)** is a critical hyperparameter for balancing computational efficiency and model performance in recurrent neural networks. Increasing p reduces the number of WRITE pulses (hardware cost) while improving log-loss (model quality), with optimal performance achieved at p > 1500. However, the persistence of high log-loss (4.5) at moderate p values highlights the need for careful tuning to avoid suboptimal configurations. The scatter plot underscores the trade-off between resource usage and accuracy, guiding practitioners to prioritize higher p values for efficient, high-performing models.