## Scatter Plot: abstract_algebra
### Overview
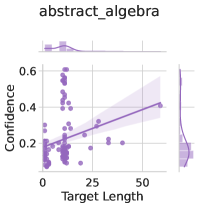
The image is a scatter plot titled "abstract_algebra" with a trend line and shaded confidence interval. It includes histograms on the top and right axes, showing distributions of "Target Length" and "Confidence" respectively. The plot visualizes the relationship between "Target Length" (x-axis) and "Confidence" (y-axis), with data points and a regression line.
### Components/Axes
- **Title**: "abstract_algebra" (top center).
- **X-axis**: "Target Length" (horizontal axis), labeled with ticks at 0, 25, 50. Scale ranges from 0 to 50.
- **Y-axis**: "Confidence" (vertical axis), labeled with ticks at 0, 0.2, 0.4, 0.6. Scale ranges from 0 to 0.6.
- **Legend**: Not explicitly labeled, but the trend line is represented by a solid purple line with a shaded purple confidence interval.
- **Histograms**:
- **Top histogram**: Bar chart for "Target Length" (x-axis distribution).
- **Right histogram**: Bar chart for "Confidence" (y-axis distribution).
### Detailed Analysis
- **Data Points**: Purple dots scattered across the plot. Most points cluster near the lower-left (low Target Length, low Confidence), with some spread toward higher values.
- **Trend Line**: A solid purple line slopes upward from ~0.15 at Target Length 0 to ~0.45 at Target Length 50. The shaded area around the line (confidence interval) widens slightly as Target Length increases.
- **Histograms**:
- **Target Length**: Bars show a bimodal distribution, with peaks near 0 and 25, and a smaller peak near 50.
- **Confidence**: Bars show a right-skewed distribution, with most values concentrated between 0.2 and 0.4.
### Key Observations
1. **Positive Correlation**: The trend line indicates a general increase in Confidence with Target Length, though the relationship is not perfectly linear.
2. **Confidence Interval**: The shaded area suggests uncertainty in the trend line, with wider variability at higher Target Length values.
3. **Distribution Patterns**:
- Target Length has a bimodal distribution, suggesting two common ranges (0–25 and 25–50).
- Confidence values are more concentrated in the 0.2–0.4 range, with fewer extreme values.
### Interpretation
The data suggests that **Target Length** and **Confidence** are positively correlated, but the relationship is not deterministic. The upward trend line implies that longer Target Lengths generally correspond to higher Confidence, though the shaded confidence interval indicates variability in this relationship. The bimodal distribution of Target Length may reflect distinct subgroups or categories within the data, while the right-skewed Confidence distribution highlights that most values cluster in the mid-range. Outliers (e.g., high Confidence at low Target Length) suggest exceptions to the general trend, possibly indicating anomalies or special cases in the dataset. This analysis could inform models where Target Length influences Confidence, but the uncertainty in the trend line emphasizes the need for further validation.