## Chart: Confidence vs. Target Length in Abstract Algebra
### Overview
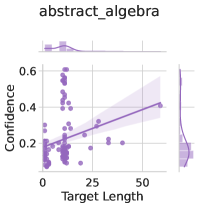
This image presents a scatter plot showing the relationship between "Confidence" and "Target Length" in the context of "abstract_algebra". The plot includes a regression line with a confidence interval, as well as marginal distributions for both variables.
### Components/Axes
* **Title:** abstract\_algebra (located at the top of the chart)
* **X-axis:** Target Length (horizontal axis), ranging from 0 to approximately 50.
* **Y-axis:** Confidence (vertical axis), ranging from 0 to approximately 0.6.
* **Data Points:** Purple dots representing individual data points.
* **Regression Line:** A purple line indicating the linear relationship between Target Length and Confidence.
* **Confidence Interval:** A shaded purple region around the regression line, representing the uncertainty in the estimated relationship.
* **Marginal Distributions:** Histograms and kernel density estimates along the top (for Target Length) and right side (for Confidence).
### Detailed Analysis
* **Target Length:** The Target Length ranges from approximately 0 to 50. The marginal distribution shows a concentration of values near 0, with a long tail extending to higher values.
* **Confidence:** The Confidence ranges from approximately 0 to 0.6. The marginal distribution shows a peak around 0.2, with a spread of values up to 0.6.
* **Scatter Plot:** The scatter plot shows a positive correlation between Target Length and Confidence. As Target Length increases, Confidence tends to increase as well.
* **Regression Line:** The regression line slopes upward, confirming the positive correlation.
* **Confidence Interval:** The confidence interval widens as Target Length increases, indicating greater uncertainty in the estimated relationship at higher values of Target Length.
### Key Observations
* There is a positive correlation between Target Length and Confidence.
* The majority of data points are clustered at lower Target Length values.
* The confidence interval widens as Target Length increases, indicating greater uncertainty.
### Interpretation
The chart suggests that in the context of "abstract_algebra", there is a tendency for higher "Confidence" to be associated with longer "Target Lengths". However, the widening confidence interval indicates that this relationship is less certain at higher Target Lengths, possibly due to fewer data points in that range. The concentration of data points at lower Target Lengths suggests that shorter targets are more common in the dataset. The positive correlation could imply that more complex or lengthy problems (higher Target Length) are associated with higher confidence levels, possibly because they require a deeper understanding of the subject matter.