## Scatter Plot: high_school_european_history
### Overview
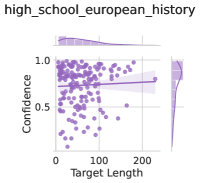
The image is a scatter plot titled "high_school_european_history". It displays the relationship between "Target Length" on the x-axis and "Confidence" on the y-axis. The plot includes a regression line with a confidence interval. Density plots are shown along the top and right margins, representing the distributions of Target Length and Confidence, respectively.
### Components/Axes
* **Title:** high\_school\_european\_history
* **X-axis:**
* Label: Target Length
* Scale: 0 to 200, with tick marks at approximately 0, 100, and 200.
* **Y-axis:**
* Label: Confidence
* Scale: 0 to 1.0, with tick marks at 0, 0.5, and 1.0.
* **Data Points:** Each data point is represented by a purple circle.
* **Regression Line:** A purple line represents the linear regression fit to the data.
* **Confidence Interval:** A shaded purple region around the regression line represents the confidence interval.
* **Marginal Density Plots:** Density plots are displayed along the top (for Target Length) and right (for Confidence).
### Detailed Analysis
* **Data Point Distribution:** The data points are concentrated in the lower range of Target Length (0-100) and span a wide range of Confidence values (approximately 0.2 to 1.0). As Target Length increases, the density of data points decreases.
* **Regression Line:** The regression line has a slight positive slope, indicating a weak positive correlation between Target Length and Confidence.
* **Confidence Interval:** The confidence interval widens as Target Length increases, suggesting greater uncertainty in the regression fit for larger Target Length values.
* **Marginal Density Plots:**
* The Target Length density plot shows a peak near the lower end of the range, indicating that most data points have smaller Target Length values.
* The Confidence density plot shows a relatively uniform distribution, with a slight peak near 1.0.
### Key Observations
* There is a weak positive correlation between Target Length and Confidence.
* The majority of data points have smaller Target Length values.
* The confidence in the regression fit decreases as Target Length increases.
### Interpretation
The scatter plot suggests that, for the "high_school_european_history" dataset, there is a slight tendency for confidence to increase with target length, but the relationship is weak. The concentration of data points at lower target lengths indicates that most data points fall within this range. The widening confidence interval suggests that the relationship between target length and confidence is less certain for larger target lengths. The marginal density plots provide additional information about the distributions of target length and confidence, confirming that target length is skewed towards lower values and confidence is relatively uniformly distributed.