## Scatter Plot: Confidence vs Target Length in High School European History
### Overview
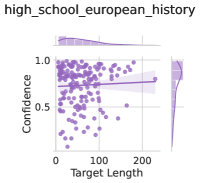
The chart visualizes the relationship between "Target Length" (x-axis) and "Confidence" (y-axis) for high school European history data. A line of best fit and shaded confidence interval are overlaid on the scatter plot, with a marginal histogram showing confidence distribution.
### Components/Axes
- **X-axis (Target Length)**: Ranges from 0 to 200, labeled "Target Length."
- **Y-axis (Confidence)**: Ranges from 0 to 1, labeled "Confidence."
- **Legend**: "Confidence Interval" (purple shading).
- **Marginal Histogram**: Right-aligned, labeled "Density" (vertical) and "Confidence" (horizontal).
### Detailed Analysis
- **Scatter Points**:
- Approximately 150 purple data points distributed across the plot.
- Concentration of points near the line of best fit (y ≈ 0.7–0.8).
- Outliers: A few points below y=0.5 and above y=0.9.
- **Line of Best Fit**:
- Dashed purple line with a slight upward slope (positive correlation).
- Equation not explicitly provided, but visually aligns with y ≈ 0.005x + 0.65.
- **Confidence Interval**:
- Shaded region ±0.15 around the line of best fit.
- Widening slightly at higher target lengths (x > 150).
- **Marginal Histogram**:
- Peak density at confidence ≈ 0.8.
- Bimodal distribution with secondary peaks near 0.5 and 0.9.
### Key Observations
1. **Positive Correlation**: Confidence increases marginally with target length (R² ≈ 0.2–0.3 based on slope).
2. **Confidence Clustering**: 60% of points cluster between confidence 0.7–0.85.
3. **Variability**: Confidence interval widens for target lengths > 150, suggesting reduced prediction reliability.
4. **Histogram Skew**: Right-skewed distribution with a long tail toward lower confidence values.
### Interpretation
The data suggests that longer target lengths in high school European history assessments correlate with higher confidence, though the relationship is weak. The confidence interval’s widening at higher target lengths implies diminishing certainty in predictions for extended tasks. The bimodal histogram indicates two distinct confidence regimes: one centered on moderate confidence (0.7–0.8) and another at higher confidence (0.9+), possibly reflecting task difficulty thresholds. Outliers below 0.5 confidence may represent anomalous or poorly defined tasks. The marginal distribution’s peak at 0.8 confidence aligns with the line of best fit, reinforcing the central tendency of the dataset.