\n
## Bar Chart: Ratio of Content Words to Function Words
### Overview
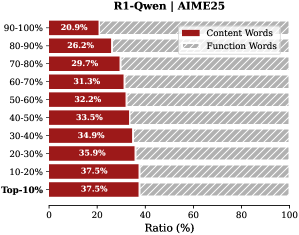
The image presents a horizontal bar chart illustrating the ratio (in percentage) of content words to function words across different frequency ranges. The chart is titled "R1-Qwen | AIME25". The x-axis represents the ratio in percentage, ranging from 0 to 100. The y-axis represents frequency ranges, from "Top 10%" to "90-100%". Two data series are displayed: "Content Words" (represented by dark red bars) and "Function Words" (represented by light gray bars).
### Components/Axes
* **Title:** R1-Qwen | AIME25 (top-center)
* **X-axis Label:** Ratio (%) (bottom-center)
* **Y-axis Label:** Frequency Ranges (left-side)
* **Legend:** Located in the top-right corner.
* "Content Words" - Dark Red
* "Function Words" - Light Gray
* **Y-axis Markers (Frequency Ranges):**
* Top 10%
* 10-20%
* 20-30%
* 30-40%
* 40-50%
* 50-60%
* 60-70%
* 70-80%
* 80-90%
* 90-100%
### Detailed Analysis
The chart displays the percentage of content words and function words for each frequency range. The function word percentage is represented by the length of the gray bars, while the content word percentage is represented by the length of the red bars.
Here's a breakdown of the data points:
* **Top 10%:** Content Words: 37.5%, Function Words: ~62.5%
* **10-20%:** Content Words: 37.5%, Function Words: ~62.5%
* **20-30%:** Content Words: 35.9%, Function Words: ~64.1%
* **30-40%:** Content Words: 34.9%, Function Words: ~65.1%
* **40-50%:** Content Words: 33.5%, Function Words: ~66.5%
* **50-60%:** Content Words: 32.2%, Function Words: ~67.8%
* **60-70%:** Content Words: 31.3%, Function Words: ~68.7%
* **70-80%:** Content Words: 29.7%, Function Words: ~70.3%
* **80-90%:** Content Words: 26.2%, Function Words: ~73.8%
* **90-100%:** Content Words: 20.9%, Function Words: ~79.1%
**Trend Verification:** The content word percentage consistently decreases as the frequency range increases, while the function word percentage increases. This is visually apparent as the red bars become shorter and the gray bars remain relatively constant in length as you move up the y-axis.
### Key Observations
* The ratio of function words to content words is significantly higher in lower frequency ranges (90-100%) compared to higher frequency ranges (Top 10%).
* The difference in percentage between content and function words is most pronounced in the 90-100% range.
* The content word percentage decreases steadily across all frequency ranges.
### Interpretation
The data suggests that function words (articles, prepositions, conjunctions, etc.) are more prevalent in less frequent words, while content words (nouns, verbs, adjectives, etc.) dominate the most frequent words. This is consistent with linguistic theory, as function words provide grammatical structure and are essential for sentence formation, while content words carry the primary meaning. The decreasing trend of content word ratio with increasing frequency suggests that the most common words in a corpus are primarily grammatical elements rather than semantic ones. The "R1-Qwen | AIME25" title suggests this data is related to a specific language model (R1-Qwen) and a dataset (AIME25), potentially indicating the model's vocabulary distribution or the characteristics of the training data. The consistent trend suggests a robust pattern within the dataset and model.