## Horizontal Bar Chart: R1-Qwen | AIME25
### Overview
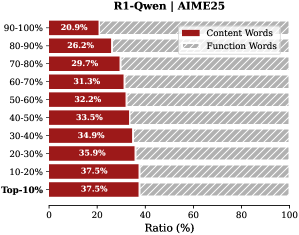
The chart visualizes the distribution of **Content Words** (red) and **Function Words** (gray with diagonal stripes) across different performance percentile ranges (90-100% to Top-10%). Each bar represents the percentage ratio of Content Words within a specific percentile category. Function Words are implied as the complementary portion but are not explicitly labeled with numerical values.
### Components/Axes
- **Title**: "R1-Qwen | AIME25" (top center).
- **X-Axis**: Labeled "Ratio (%)" with a scale from 0 to 100.
- **Y-Axis**: Categories ordered from top to bottom:
`90-100%`, `80-90%`, `70-80%`, `60-70%`, `50-60%`, `40-50%`, `30-40%`, `20-30%`, `10-20%`, `Top-10%`.
- **Legend**: Located on the right, with:
- **Red**: Content Words.
- **Gray (diagonal stripes)**: Function Words.
### Detailed Analysis
- **Content Words (Red Bars)**:
- `90-100%`: 20.9%
- `80-90%`: 26.2%
- `70-80%`: 29.7%
- `60-70%`: 31.3%
- `50-60%`: 32.2%
- `40-50%`: 33.5%
- `30-40%`: 34.9%
- `20-30%`: 35.9%
- `10-20%`: 37.5%
- `Top-10%`: 37.5%
- **Function Words (Gray Bars)**:
- No explicit numerical values are provided in the image. However, the gray bars visually represent the remaining percentage (100% - Content Words) for each category. For example:
- `90-100%`: ~79.1% (100% - 20.9%).
- `Top-10%`: ~62.5% (100% - 37.5%).
### Key Observations
1. **Content Words Trend**:
- Content Words increase monotonically as percentile ranges decrease (e.g., 20.9% in `90-100%` to 37.5% in `Top-10%`).
- The highest ratios occur in the lowest percentile categories (`10-20%` and `Top-10%`).
2. **Function Words Inference**:
- Function Words decrease as Content Words increase, suggesting an inverse relationship between the two categories.
3. **Symmetry in Top Categories**:
- `10-20%` and `Top-10%` share identical Content Word ratios (37.5%), indicating a potential threshold or saturation point.
### Interpretation
The data suggests that higher-performing or more relevant items (lower percentile ranges, e.g., `Top-10%`) are characterized by a greater proportion of **Content Words** relative to **Function Words**. This could imply:
- **Semantic Richness**: Lower-ranked items (e.g., `90-100%`) may prioritize functional language (e.g., prepositions, conjunctions), while higher-ranked items focus on substantive content.
- **Performance Correlation**: The inverse relationship might reflect a design choice where content density correlates with effectiveness in the AIME25 benchmark.
- **Threshold Effect**: The plateau at 37.5% in the top two categories (`10-20%` and `Top-10%`) could indicate diminishing returns or a cap on content word utility beyond this point.
The chart highlights a clear trend where Content Words dominate in lower percentile ranges, potentially guiding optimizations for text generation or analysis in similar benchmarks.