\n
## Diagram: Learning Paradigms
### Overview
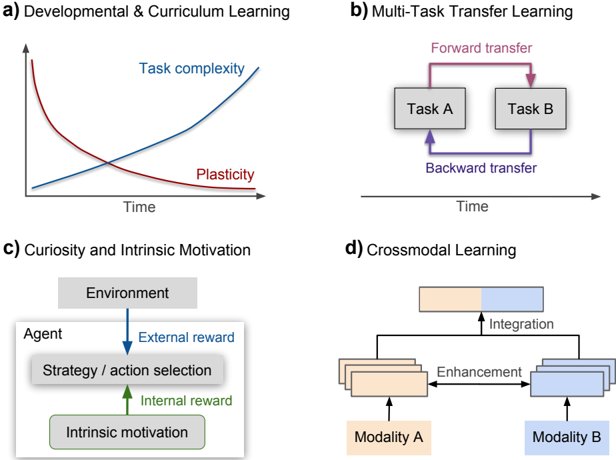
The image presents four diagrams illustrating different learning paradigms: Developmental & Curriculum Learning, Multi-Task Transfer Learning, Curiosity and Intrinsic Motivation, and Crossmodal Learning. Each diagram uses simplified graphical representations to convey the core concepts of each paradigm. The diagrams are arranged in a 2x2 grid.
### Components/Axes
Each sub-diagram has its own labels.
* **a) Developmental & Curriculum Learning:** X-axis labeled "Time". Y-axis is not explicitly labeled, but represents a scale for both "Task complexity" and "Plasticity".
* **b) Multi-Task Transfer Learning:** X-axis labeled "Time".
* **c) Curiosity and Intrinsic Motivation:** No explicit axes.
* **d) Crossmodal Learning:** No explicit axes.
### Detailed Analysis or Content Details
**a) Developmental & Curriculum Learning:**
* **Task complexity:** Represented by a blue line. The line starts at a low value at the left (approximately 0 at Time=0) and increases monotonically to a higher value at the right (approximately 1.2 at Time=1). The trend is upward.
* **Plasticity:** Represented by a red line. The line starts at a high value at the left (approximately 1.0 at Time=0) and decreases monotonically to a lower value at the right (approximately 0.2 at Time=1). The trend is downward.
**b) Multi-Task Transfer Learning:**
* **Task A:** A gray rectangle labeled "Task A" positioned on the left side of the diagram.
* **Task B:** A gray rectangle labeled "Task B" positioned on the right side of the diagram.
* **Forward transfer:** A purple arrow originating from Task A and pointing towards Task B.
* **Backward transfer:** A purple arrow originating from Task B and pointing towards Task A.
**c) Curiosity and Intrinsic Motivation:**
* **Environment:** A gray rectangle labeled "Environment" positioned at the top of the diagram.
* **Agent:** A gray rectangle labeled "Agent" positioned below the "Environment".
* **Strategy / action selection:** A blue rectangle positioned within the "Agent" rectangle.
* **External reward:** A red arrow originating from the "Environment" and pointing towards the "Strategy / action selection".
* **Intrinsic motivation:** A green rectangle positioned below the "Agent" rectangle.
* **Internal reward:** A green arrow originating from the "Intrinsic motivation" and pointing towards the "Strategy / action selection".
**d) Crossmodal Learning:**
* **Modality A:** A stack of light orange rectangles labeled "Modality A" positioned on the left side of the diagram.
* **Modality B:** A stack of light blue rectangles labeled "Modality B" positioned on the right side of the diagram.
* **Enhancement:** Light orange and light blue rectangles stacked on top of "Modality A" and "Modality B" respectively.
* **Integration:** A stack of light orange and light blue rectangles positioned above the "Enhancement" rectangles, labeled "Integration".
### Key Observations
* Diagram (a) shows an inverse relationship between task complexity and plasticity over time.
* Diagram (b) illustrates bidirectional transfer of knowledge between two tasks.
* Diagram (c) depicts the interplay between external rewards from the environment and internal motivation within an agent.
* Diagram (d) demonstrates how information from two modalities can be enhanced and integrated.
### Interpretation
The image provides a high-level overview of four distinct learning paradigms.
* **Developmental & Curriculum Learning (a)** suggests that learning progresses from simpler to more complex tasks, accompanied by a decrease in the brain's plasticity.
* **Multi-Task Transfer Learning (b)** highlights the potential for leveraging knowledge gained from one task to improve performance on another, and vice versa.
* **Curiosity and Intrinsic Motivation (c)** emphasizes the role of internal drives in learning, alongside external rewards.
* **Crossmodal Learning (d)** illustrates how combining information from different sensory modalities can lead to richer and more robust representations.
The diagrams are conceptual and do not provide specific numerical data. They serve as visual aids to understand the core principles of each learning paradigm. The use of arrows and color-coding effectively conveys the direction of information flow and the relationships between different components. The diagrams are interconnected in that they all represent different approaches to improving learning systems, whether artificial or biological.