\n
## Histogram: Distribution of Question Lengths
### Overview
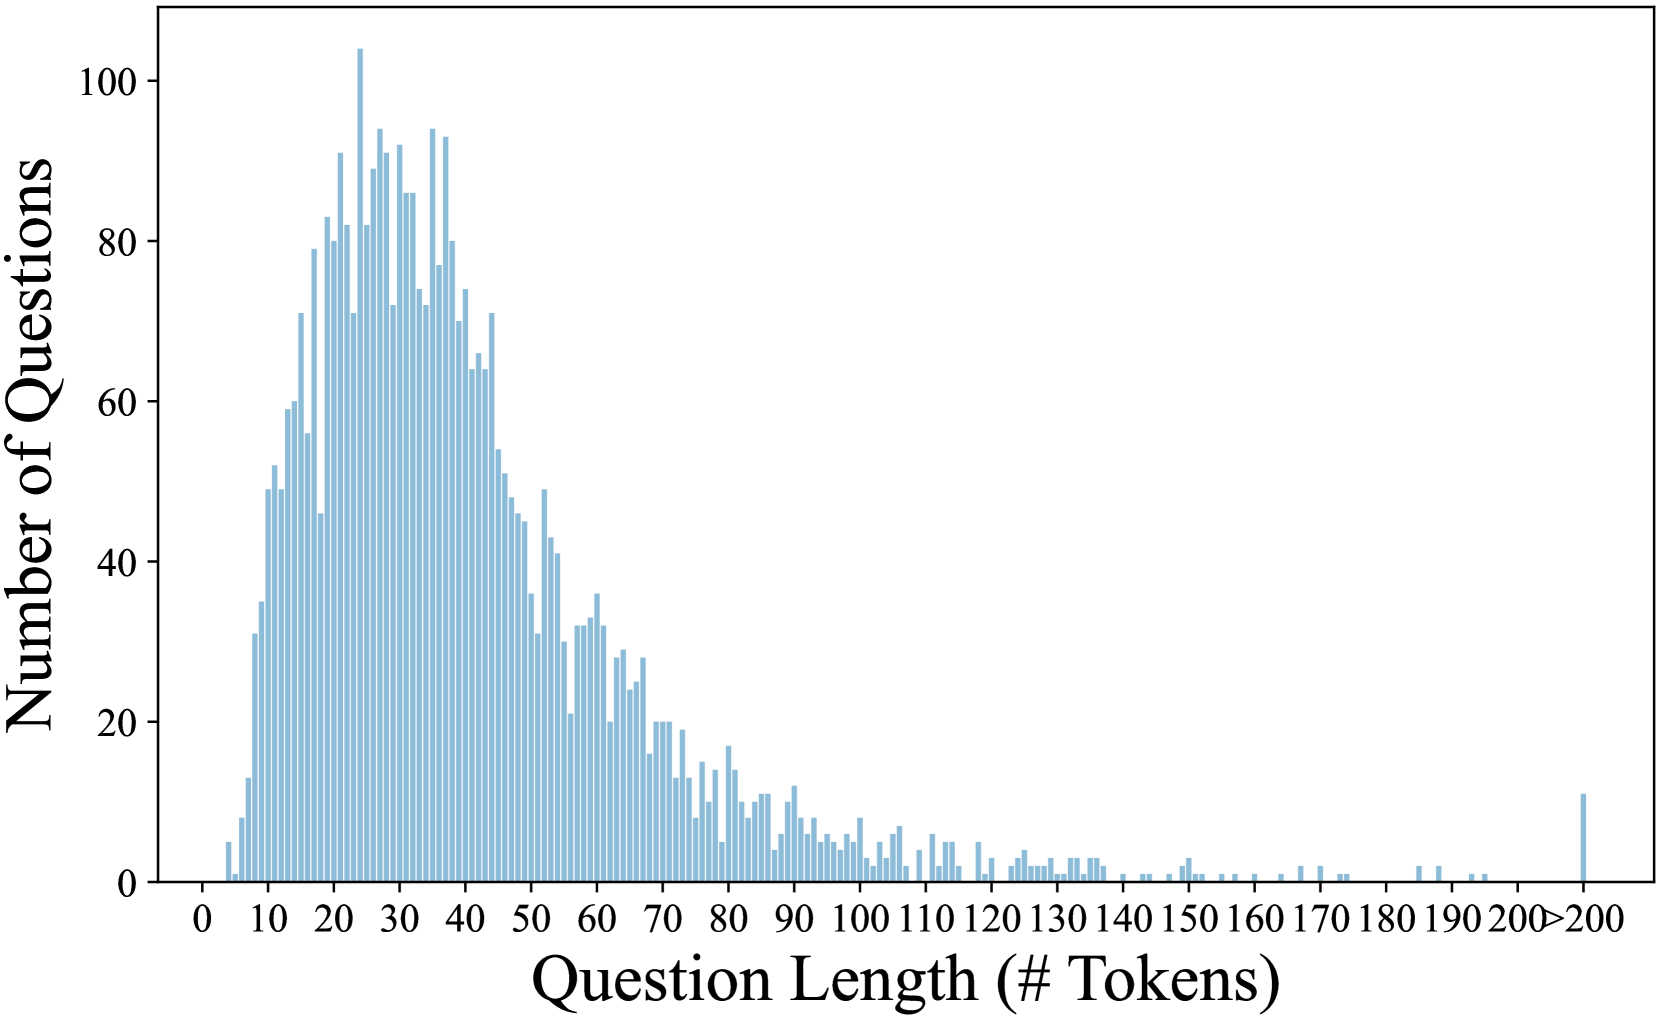
The image presents a histogram visualizing the distribution of question lengths, measured in the number of tokens. The x-axis represents the question length, ranging from 0 to 200 tokens, while the y-axis represents the number of questions falling within each length bin. The histogram is constructed using vertical bars, each representing a range of question lengths.
### Components/Axes
* **X-axis Title:** "Question Length (# Tokens)"
* **X-axis Scale:** Ranges from 0 to 200 tokens, with tick marks every 10 tokens.
* **Y-axis Title:** "Number of Questions"
* **Y-axis Scale:** Ranges from 0 to 100, with tick marks every 20 questions.
* **Histogram Bars:** Represent the frequency of questions within each token length bin. The bars are filled with a light blue color.
### Detailed Analysis
The histogram shows a strong concentration of questions falling within the length range of approximately 20 to 60 tokens. The distribution is heavily skewed to the right, indicating that most questions are relatively short, with a decreasing number of questions as the length increases.
Here's a breakdown of approximate values, reading from left to right:
* **0-10 Tokens:** Approximately 5-10 questions.
* **10-20 Tokens:** Approximately 20-30 questions.
* **20-30 Tokens:** Approximately 80-90 questions.
* **30-40 Tokens:** Approximately 90-100 questions.
* **40-50 Tokens:** Approximately 70-80 questions.
* **50-60 Tokens:** Approximately 40-50 questions.
* **60-70 Tokens:** Approximately 20-30 questions.
* **70-80 Tokens:** Approximately 10-20 questions.
* **80-90 Tokens:** Approximately 5-10 questions.
* **90-100 Tokens:** Approximately 5 questions.
* **100-110 Tokens:** Approximately 2-5 questions.
* **110-120 Tokens:** Approximately 2-5 questions.
* **120-130 Tokens:** Approximately 1-3 questions.
* **130-140 Tokens:** Approximately 1-3 questions.
* **140-150 Tokens:** Approximately 1 question.
* **150-160 Tokens:** Approximately 1 question.
* **160-170 Tokens:** Approximately 0-1 questions.
* **170-180 Tokens:** Approximately 0-1 questions.
* **180-190 Tokens:** Approximately 0-1 questions.
* **190-200 Tokens:** Approximately 0-1 questions.
The peak of the distribution is around 30-40 tokens, with a slight decline as the length increases. There is a sharp drop-off in the number of questions beyond 80 tokens.
### Key Observations
* The distribution is unimodal, with a single prominent peak.
* The majority of questions are relatively short (less than 60 tokens).
* There are very few questions exceeding 100 tokens.
* The distribution is right-skewed, indicating a long tail of longer questions.
### Interpretation
The data suggests that the questions being analyzed are generally concise. This could be due to several factors, such as the nature of the task, the target audience, or the constraints of the system generating the questions. The concentration of questions around 30-40 tokens might indicate an optimal length for effective communication or processing. The long tail of longer questions could represent more complex or nuanced inquiries. The overall distribution provides insights into the characteristics of the question set and can be used to inform the design of systems that process or respond to these questions. The data could be used to optimize question answering systems, or to understand the types of questions users are likely to ask.