## Histogram: Distribution of Question Lengths in Tokens
### Overview
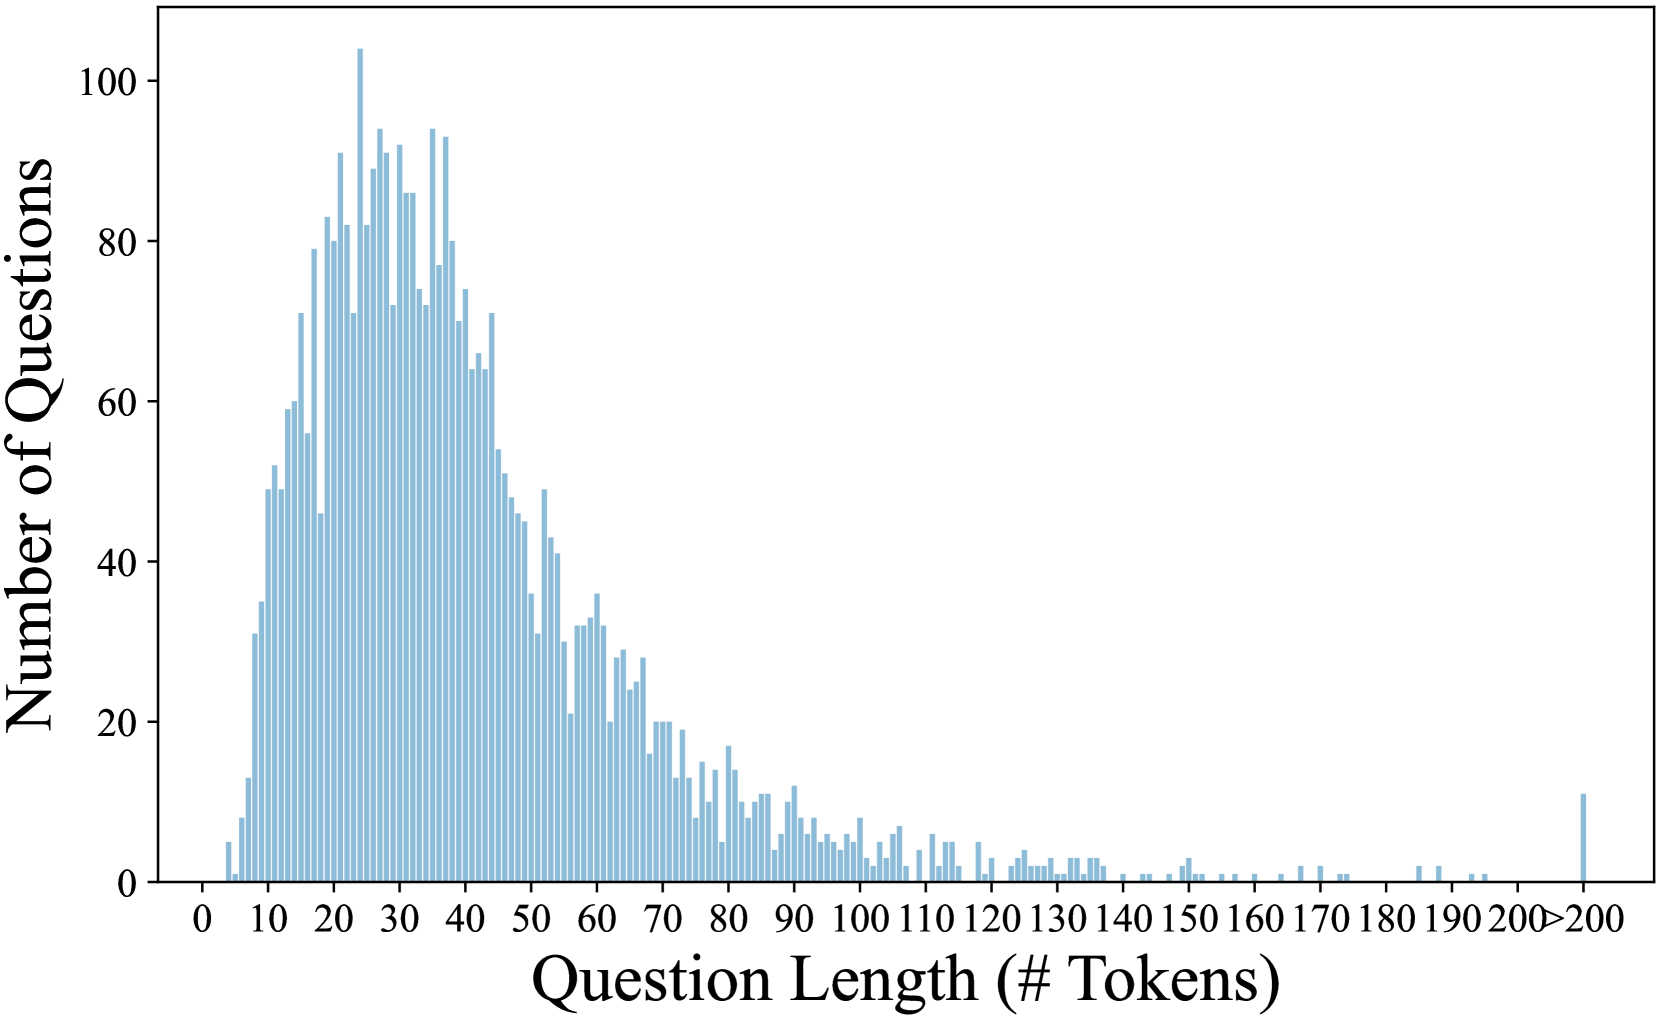
The image displays a histogram chart illustrating the frequency distribution of question lengths, measured in tokens, within a dataset. The chart shows a right-skewed distribution, indicating that most questions are relatively short, with a long tail of less frequent, longer questions.
### Components/Axes
* **Chart Type:** Histogram (vertical bar chart).
* **X-Axis (Horizontal):**
* **Label:** "Question Length (# Tokens)"
* **Scale:** Linear scale from 0 to 200, with major tick marks and labels every 10 units (0, 10, 20, ..., 200). The final bin is labeled ">200".
* **Y-Axis (Vertical):**
* **Label:** "Number of Questions"
* **Scale:** Linear scale from 0 to 100, with major tick marks and labels every 20 units (0, 20, 40, 60, 80, 100).
* **Data Series:** A single series represented by light blue vertical bars. Each bar's height corresponds to the count of questions falling within a specific token-length bin.
* **Legend:** Not present, as there is only one data series.
* **Language:** All text in the chart is in English.
### Detailed Analysis
The histogram bins appear to have a width of approximately 1-2 tokens, creating a detailed view of the distribution.
* **Trend Verification:** The visual trend shows a rapid increase in frequency from 0 tokens, peaking in the 20-40 token range, followed by a steady, gradual decline as question length increases. The distribution has a long right tail extending past 200 tokens.
* **Peak/Mode:** The highest frequency (mode) occurs in the bin corresponding to approximately **25-30 tokens**. The bar at this peak reaches a height of just over **100 questions** (approx. 102-105).
* **High-Frequency Region:** A dense cluster of high bars exists between roughly **15 and 45 tokens**. Within this range, multiple bars exceed 80 questions.
* **Decline:** After the 45-token mark, the frequency shows a consistent downward trend. By 100 tokens, the count per bin drops below 10 questions.
* **Long Tail:** From 100 to 200 tokens, the bars are very short, often representing fewer than 5 questions per bin, with many bins appearing empty.
* **Final Bin (">200"):** There is a small but distinct bar at the far right for questions longer than 200 tokens. Its height is approximately **10-12 questions**.
### Key Observations
1. **Right-Skewed Distribution:** The data is not symmetric. The mass of the distribution is concentrated on the left (shorter questions), with a tail stretching to the right (longer questions).
2. **Dominant Length Range:** The vast majority of questions in this dataset are between **10 and 60 tokens** long.
3. **Rare Long Questions:** Questions exceeding 100 tokens are uncommon, and those over 200 tokens are rare outliers.
4. **Smooth Decline:** The decrease in frequency after the peak is relatively smooth, without major secondary peaks, suggesting a single underlying pattern in question composition.
### Interpretation
This histogram characterizes the length profile of a collection of questions, likely from a user query dataset, a benchmark, or a conversational AI log.
* **What the data suggests:** The distribution indicates that users or creators predominantly formulate concise questions. The peak at 25-30 tokens suggests a "sweet spot" for question complexity—long enough to be specific but short enough to be easily digestible.
* **How elements relate:** The x-axis (length) directly determines the y-axis (frequency). The shape of the curve is a fundamental property of the dataset, revealing its inherent structure. The ">200" bin acts as a catch-all for extreme outliers, preventing the x-axis from becoming excessively long.
* **Notable patterns/anomalies:**
* The smooth, unimodal shape is typical of many natural language length distributions.
* The small spike at ">200" is notable. It confirms the existence of a non-zero, albeit small, population of very complex or verbose questions that might warrant separate analysis (e.g., for testing model performance on long contexts).
* The absence of questions near 0 tokens is expected, as a meaningful question requires a minimum length.
**In summary, this chart provides a clear quantitative snapshot: the dataset is dominated by short-to-medium length questions, with a predictable and rapidly diminishing frequency for longer questions.** This information is crucial for understanding dataset bias, designing token-efficient systems, or setting appropriate context window limits for processing such questions.