## Bar Chart: Distribution of Question Lengths by Token Count
### Overview
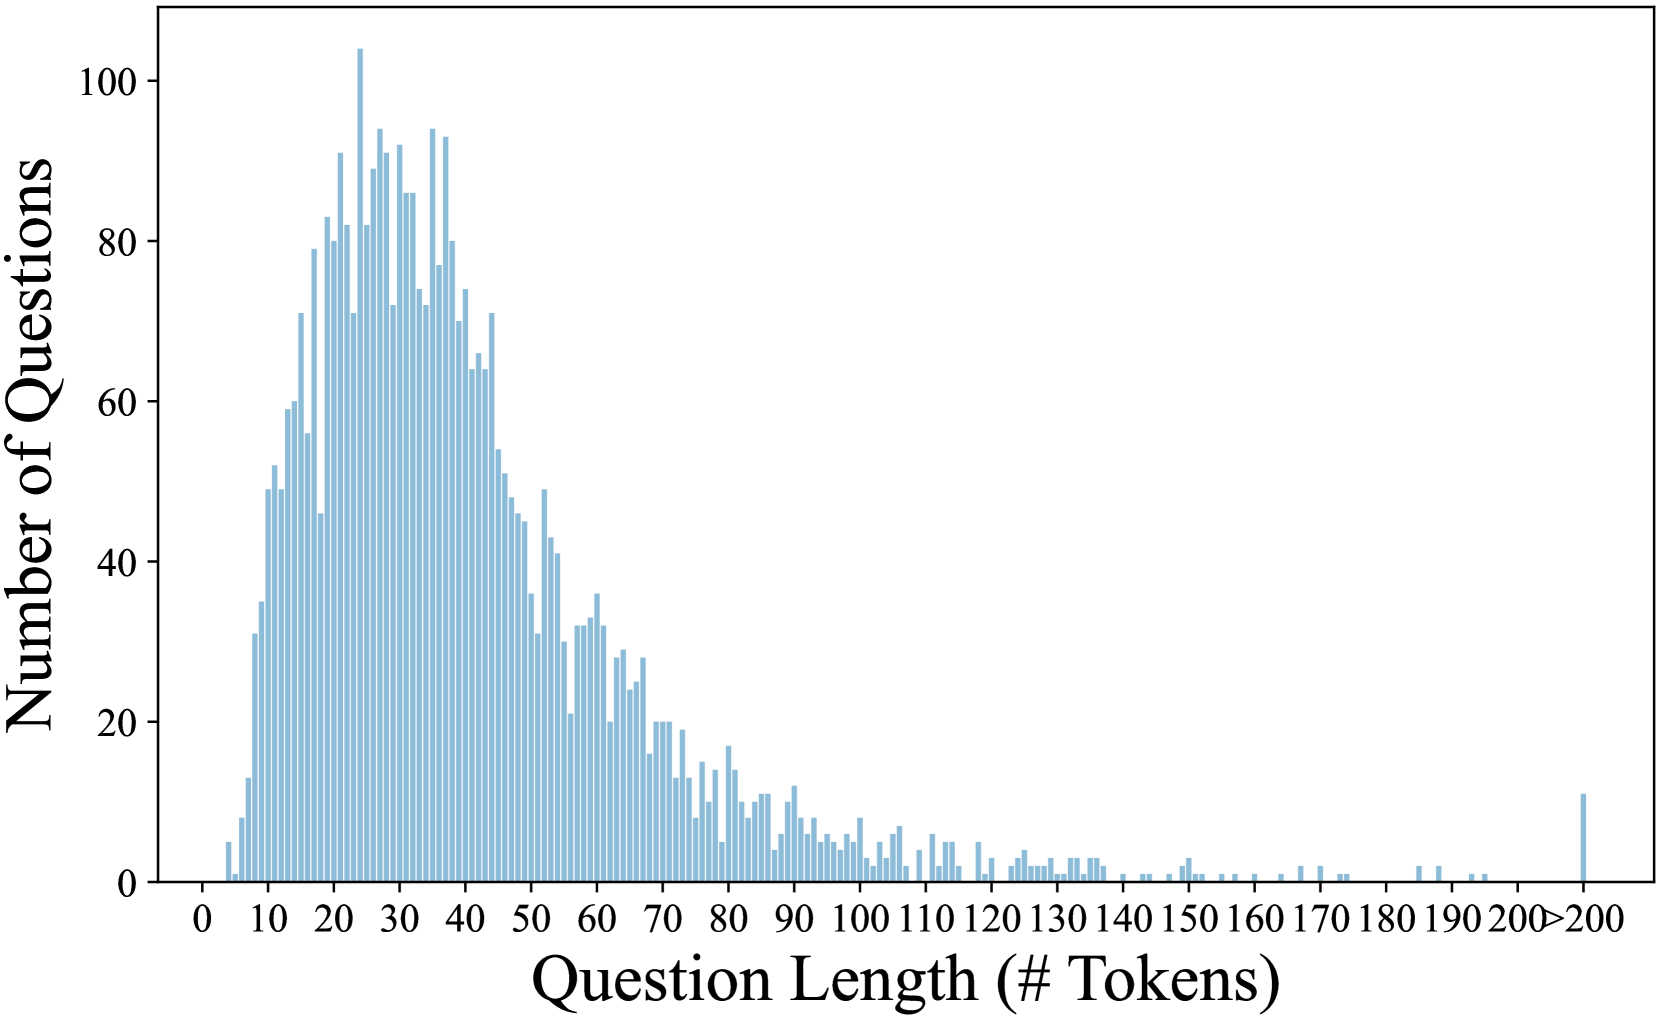
The chart displays a distribution of question lengths measured in token counts, with the number of questions plotted on the y-axis. The data shows a left-skewed distribution, peaking at shorter token lengths and tapering off for longer lengths, with a notable outlier at the upper end.
### Components/Axes
- **X-axis (Question Length (# Tokens))**:
- Scale: 0 to 200+ tokens, with intervals marked at 10, 20, 30, ..., 200+.
- Labels: "Question Length (# Tokens)" at the bottom.
- **Y-axis (Number of Questions)**:
- Scale: 0 to 100 questions, with increments of 20.
- Labels: "Number of Questions" on the left.
- **Bars**:
- Color: Blue (no legend present).
- Distribution: Vertical bars representing counts of questions for each token length.
### Detailed Analysis
- **Peak**:
- The highest frequency occurs between **20–30 tokens**, with approximately **80–100 questions**.
- Adjacent bins (10–20 tokens and 30–40 tokens) show slightly lower counts (~60–80 questions).
- **Decline**:
- A gradual decrease in question counts is observed from 40 tokens onward, dropping to ~20 questions by 60 tokens.
- Further declines continue, with counts below 10 questions for lengths >100 tokens.
- **Outlier**:
- A small spike at **200+ tokens** with ~10 questions, significantly lower than the peak.
### Key Observations
1. **Concentration in Short Questions**:
- Over 70% of questions fall within the **10–50 token range**, indicating a preference for concise queries.
2. **Long-Tail Distribution**:
- Questions exceeding 100 tokens are rare, with counts dropping sharply after 50 tokens.
3. **Anomaly at 200+ Tokens**:
- The isolated spike at the upper end suggests either specialized queries or potential data artifacts.
### Interpretation
The data suggests that most questions in the dataset are designed to be brief and direct, likely reflecting user intent for efficiency. The left-skewed distribution aligns with typical human communication patterns, where shorter messages dominate. The outlier at 200+ tokens could represent:
- Complex, multi-part questions (e.g., technical or legal inquiries).
- Data entry errors or edge cases in the dataset.
This distribution has implications for systems processing these questions, such as token budgeting in language models or UI design for input fields. Further investigation into the 200+ token category is warranted to determine its validity and relevance.