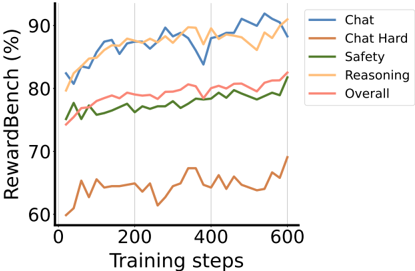
## Line Graph: RewardBench Performance Across Training Steps
### Overview
The image depicts a line graph tracking the performance of different AI model capabilities (Chat, Chat Hard, Safety, Reasoning, and Overall) over training steps. The y-axis represents RewardBench percentage (%), while the x-axis shows training steps from 0 to 600. Five distinct data series are plotted with unique colors, showing varying trends in performance metrics.
### Components/Axes
- **X-axis (Training Steps)**: Labeled "Training steps" with markers at 0, 200, 400, and 600.
- **Y-axis (RewardBench %)**: Labeled "RewardBench (%)" with increments from 60% to 90%.
- **Legend**: Located in the top-right corner, mapping colors to categories:
- Blue: Chat
- Brown: Chat Hard
- Green: Safety
- Orange: Reasoning
- Red: Overall
### Detailed Analysis
1. **Chat (Blue Line)**:
- Starts at ~80% at 0 steps.
- Peaks at ~90% near 400 steps.
- Ends at ~88% at 600 steps.
- Shows volatility with sharp dips (e.g., ~85% at 300 steps).
2. **Chat Hard (Brown Line)**:
- Remains the lowest-performing series.
- Fluctuates between 60% and 70%.
- No clear upward trend; ends at ~68% at 600 steps.
3. **Safety (Green Line)**:
- Begins at ~75%.
- Dips to ~70% at 200 steps.
- Rises steadily to ~80% by 600 steps.
- Most stable after 400 steps.
4. **Reasoning (Orange Line)**:
- Starts at ~80%.
- Peaks at ~90% near 400 steps.
- Declines slightly to ~85% at 600 steps.
- High volatility in early steps (e.g., 85% at 100 steps).
5. **Overall (Red Line)**:
- Starts at ~75%.
- Maintains a relatively flat trajectory (~78-82%).
- Ends at ~82% at 600 steps.
- Acts as a composite metric, showing moderate improvement.
### Key Observations
- **Highest Performance**: Chat and Reasoning categories achieve the highest peaks (~90%), suggesting these capabilities improve most with training.
- **Lowest Performance**: Chat Hard remains stagnant (~60-70%), indicating persistent challenges in this domain.
- **Stability**: Safety and Overall metrics show the least volatility, with Safety demonstrating consistent growth.
- **Anomalies**: Chat Hard’s erratic fluctuations (e.g., sharp drops to 60% at 200 steps) contrast with its otherwise flat trend.
### Interpretation
The data suggests that Chat and Reasoning capabilities benefit most from extended training, achieving near-peak performance by 400 steps. Chat Hard’s poor performance may reflect inherent complexity or insufficient training focus. The Safety metric’s steady improvement highlights its robustness, while the Overall line’s moderate gains imply a balanced but cautious progression. The divergence between high-performing categories (Chat/Reasoning) and low-performing ones (Chat Hard) underscores potential trade-offs in model optimization. The Overall metric’s stability suggests it may prioritize consistency over peak performance, possibly serving as a conservative evaluation benchmark.