## Line Chart: RewardBench Performance vs. Training Steps
### Overview
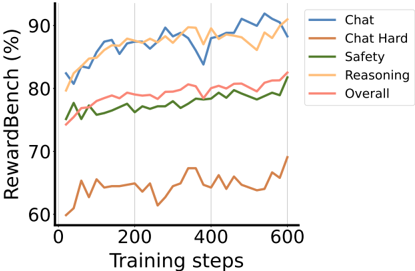
The image is a line chart comparing the performance of different categories (Chat, Chat Hard, Safety, Reasoning, and Overall) on the RewardBench benchmark as a function of training steps. The x-axis represents training steps, ranging from 0 to 600. The y-axis represents the RewardBench score in percentage, ranging from 60% to 90%.
### Components/Axes
* **X-axis:** Training steps, ranging from 0 to 600 in increments of 200.
* **Y-axis:** RewardBench (%), ranging from 60% to 90% in increments of 10%.
* **Legend (Top-Right):**
* Blue: Chat
* Brown: Chat Hard
* Green: Safety
* Orange: Reasoning
* Pink: Overall
### Detailed Analysis
* **Chat (Blue):** The line starts at approximately 80% and increases to around 88% by 200 training steps. It fluctuates between 85% and 92% from 200 to 600 training steps.
* **Chat Hard (Brown):** The line starts at approximately 60% and increases to around 65% by 200 training steps. It fluctuates between 62% and 68% from 200 to 600 training steps.
* **Safety (Green):** The line starts at approximately 75% and increases to around 78% by 200 training steps. It fluctuates between 77% and 81% from 200 to 600 training steps.
* **Reasoning (Orange):** The line starts at approximately 80% and increases to around 88% by 200 training steps. It fluctuates between 87% and 90% from 200 to 600 training steps.
* **Overall (Pink):** The line starts at approximately 75% and increases to around 79% by 200 training steps. It fluctuates between 78% and 82% from 200 to 600 training steps.
### Key Observations
* Reasoning and Chat categories achieve the highest RewardBench scores, consistently performing above 85% after 200 training steps.
* Chat Hard consistently performs the worst, with scores fluctuating around 65%.
* Safety and Overall categories show similar performance, staying between 75% and 82%.
* All categories show an initial increase in performance during the first 200 training steps, followed by a period of fluctuation.
### Interpretation
The data suggests that the "Reasoning" and "Chat" categories are the most successful in terms of RewardBench performance, while "Chat Hard" is the least successful. The initial increase in performance across all categories indicates a learning phase during the first 200 training steps. The subsequent fluctuations suggest that the models reach a point where further training does not lead to significant improvements, or that the models are experiencing some degree of overfitting or instability. The "Overall" score likely represents an average or aggregate of the other categories, which explains its intermediate performance. The "Safety" category performs slightly better than the "Overall" category.