## Chart Type: Bar Charts with Overlaid Curves
### Overview
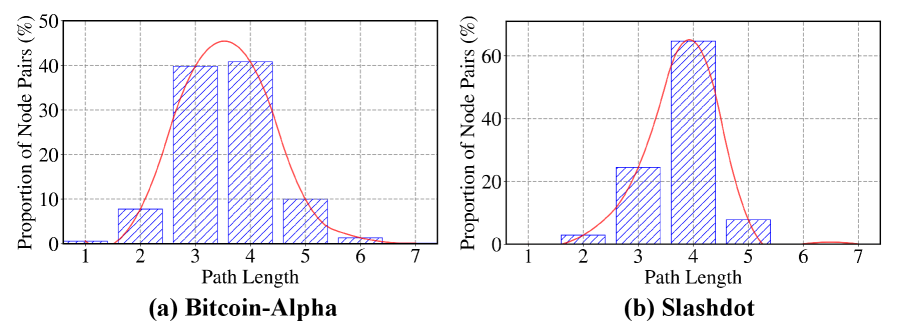
The image presents two bar charts side-by-side, each displaying the distribution of path lengths between nodes in a network. The left chart represents the "Bitcoin-Alpha" network, while the right chart represents the "Slashdot" network. The y-axis represents the "Proportion of Node Pairs (%)", and the x-axis represents "Path Length". A red curve is overlaid on each bar chart, approximating the distribution.
### Components/Axes
* **X-axis (Path Length):** Both charts share the same x-axis, ranging from 1 to 7.
* **Y-axis (Proportion of Node Pairs (%)):** The left chart's y-axis ranges from 0 to 50%. The right chart's y-axis ranges from 0 to 60%.
* **Bars:** Blue, diagonally hatched bars represent the proportion of node pairs for each path length.
* **Curve:** A red curve is overlaid on each chart, approximating the distribution of path lengths.
* **Titles:** The left chart is titled "(a) Bitcoin-Alpha", and the right chart is titled "(b) Slashdot".
* **Grid:** Both charts have a light gray grid in the background.
### Detailed Analysis
**Chart (a) Bitcoin-Alpha:**
* **Path Length 1:** Proportion of node pairs is approximately 1%.
* **Path Length 2:** Proportion of node pairs is approximately 8%.
* **Path Length 3:** Proportion of node pairs is approximately 40%.
* **Path Length 4:** Proportion of node pairs is approximately 41%.
* **Path Length 5:** Proportion of node pairs is approximately 10%.
* **Path Length 6:** Proportion of node pairs is approximately 2%.
* **Path Length 7:** Proportion of node pairs is approximately 0%.
**Trend:** The proportion of node pairs increases sharply from path length 1 to 4, then decreases gradually from path length 4 to 7. The red curve follows this trend, peaking around path length 4.
**Chart (b) Slashdot:**
* **Path Length 1:** Proportion of node pairs is approximately 0%.
* **Path Length 2:** Proportion of node pairs is approximately 2%.
* **Path Length 3:** Proportion of node pairs is approximately 23%.
* **Path Length 4:** Proportion of node pairs is approximately 64%.
* **Path Length 5:** Proportion of node pairs is approximately 6%.
* **Path Length 6:** Proportion of node pairs is approximately 0.5%.
* **Path Length 7:** Proportion of node pairs is approximately 0%.
**Trend:** The proportion of node pairs increases sharply from path length 1 to 4, then decreases gradually from path length 4 to 7. The red curve follows this trend, peaking around path length 4.
### Key Observations
* Both networks exhibit a similar distribution of path lengths, with the highest proportion of node pairs having a path length of 4.
* The Slashdot network has a higher proportion of node pairs with a path length of 4 compared to the Bitcoin-Alpha network (approximately 64% vs. 41%).
* Both networks have very few node pairs with path lengths of 1, 6, or 7.
### Interpretation
The data suggests that both the Bitcoin-Alpha and Slashdot networks have a relatively small-world structure, where most nodes are within a short path length of each other. The peak at path length 4 indicates that this is the most common distance between nodes in these networks. The higher peak for Slashdot suggests that it may have a more tightly connected structure than Bitcoin-Alpha. The red curves provide a smoothed representation of the distribution, highlighting the overall trend and making it easier to compare the two networks.